


Was using 6.1.2.00014 under Linux to debug a TI-RTOS program for a MSP432 in which the user task blocks.
When Suspend the running program to investigate, the call stack in the Debug window shows the TI-RTOS Idle task. To investigate why the user task has blocked need to investigate the call stack of the user task.
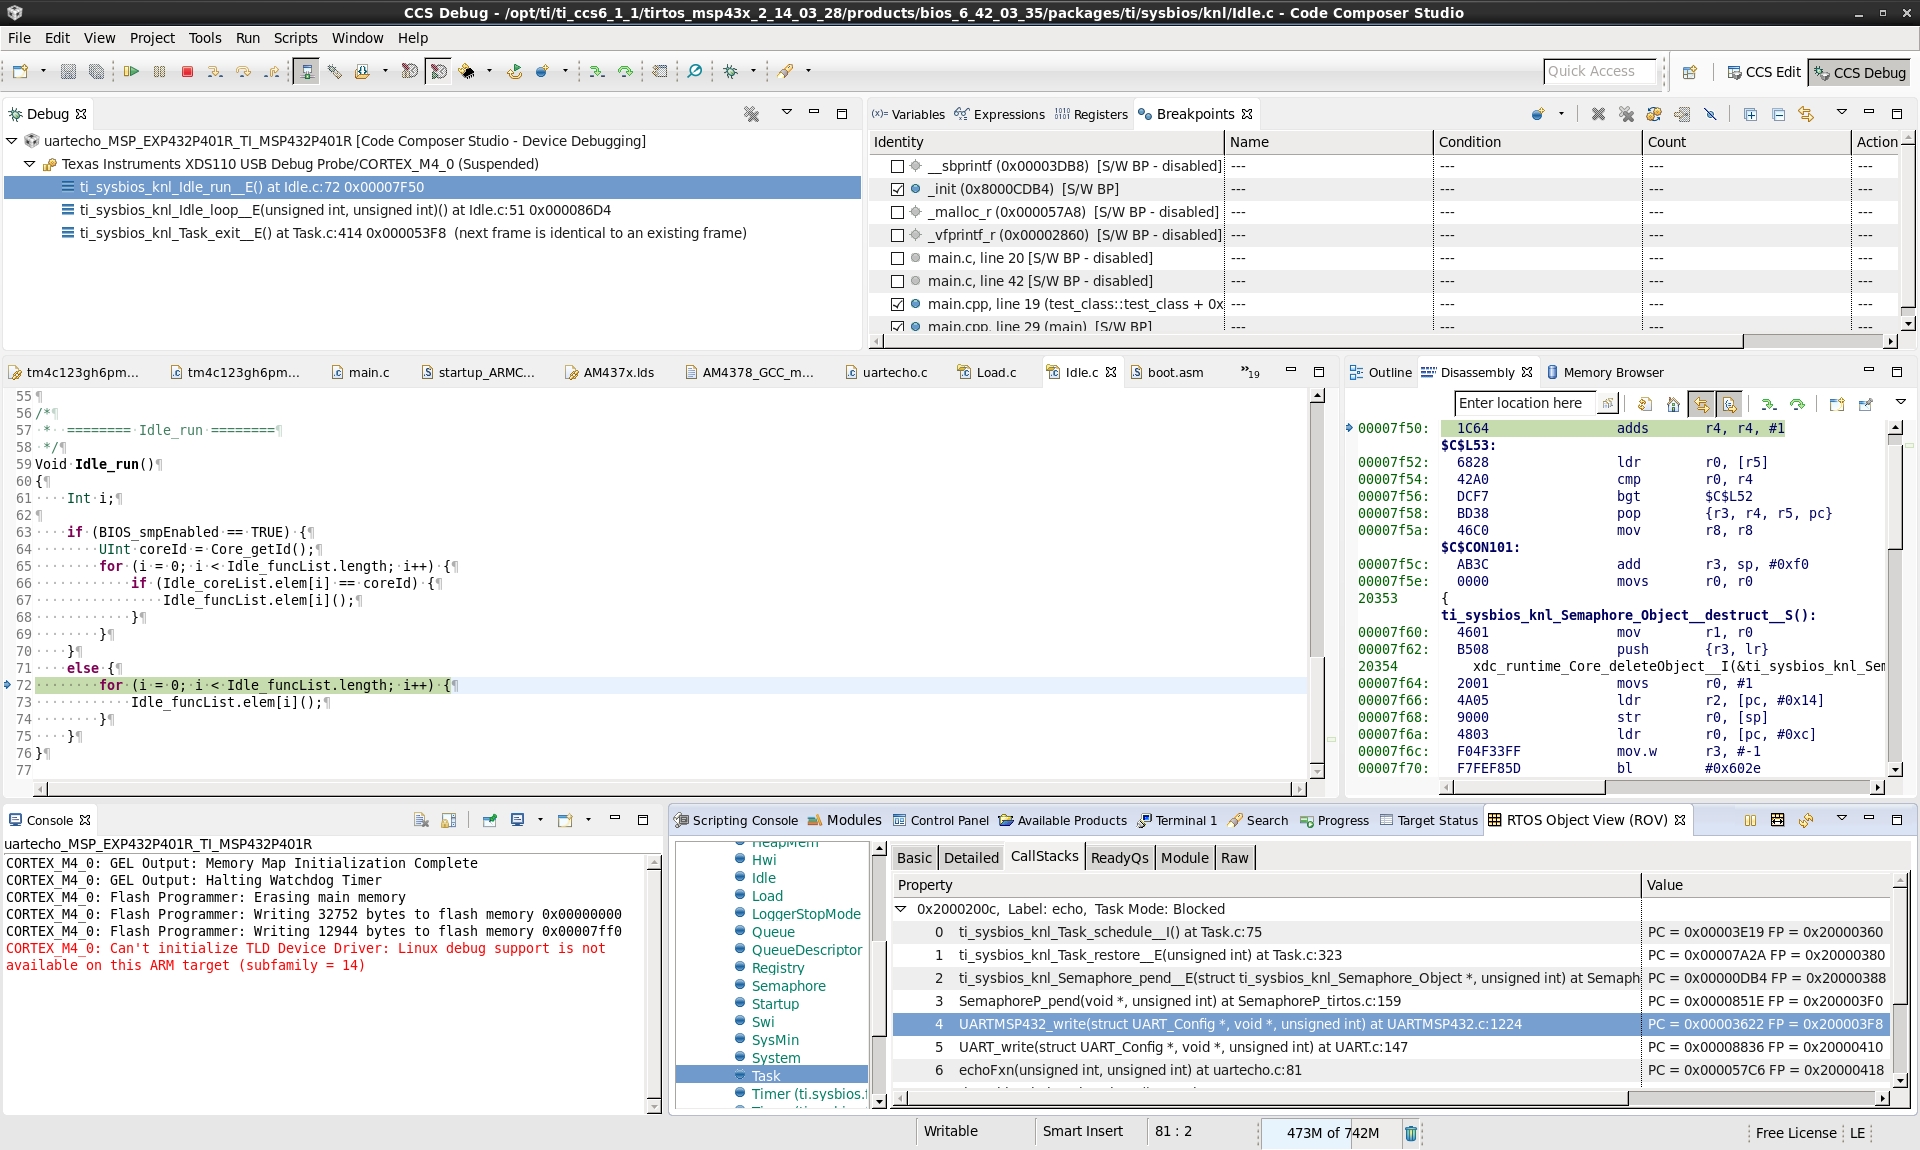
Found that under RTOS Object View (ROV) -> Task -> CallStacks could view the call stack of the blocked user task, and see that the task is blocked in a call to SemaphoreP_pend as shown in the following screen shot:
Ideally I would like to cause the CCS debugger to switch the stack back trace (debug context) from the currently running Idle task to the blocked user task to investigate. However, I can't find any way of doing that in the CCS GUI. E.g. while the ROV CallStacks view shows the source file and line numbers in the call stack right clicking on lines in the call stack there is no context option to browse to the source location (like which can be done from the hardware trace analyzer viewer).
I attempted to enable Run -> Advanced -> Enable OS Debugging but got the error "CORTEX_M4_0: Can't initialize TLD Device Driver: Linux debug support is not available on this ARM target (subfamily = 14)".
Is there an option in the CCS debugger to switch to the context of a blocked TI-RTOS task, or if not could the debugger be enhanced to add such an option?
[In other debuggers for embedded multi-task operations systems, e.g. CrossWind for VxWorks, the debugger is aware of the running tasks and can switch the debugger context to different tasks]
