This thread has been locked.

If you have a related question, please click the "Ask a related question" button in the top right corner. The newly created question will be automatically linked to this question.

CCS/AM5718: To resolve an error while debugging the board.

Anonymous
Anonymous
Part Number: AM5718


Tool/software: Code Composer Studio

[Start: Texas Instruments XDS100v2 USB Debug Probe_0]

Execute the command:

%ccs_base%/common/uscif/dbgjtag -f %boarddatafile% -rv -o -F inform,logfile=yes -S pathlength -S integrity

[Result]


-----[Print the board config pathname(s)]------------------------------------

C:\Users\BCG\AppData\Local\TEXASI~1\CCS\
ti\0\0\BrdDat\testBoard.dat

-----[Print the reset-command software log-file]-----------------------------

This utility has selected a 100- or 510-class product.
This utility will load the adapter 'jioserdesusb.dll'.
The library build date was 'Nov 27 2018'.
The library build time was '13:02:43'.
The library package version is '8.0.903.4'.
The library component version is '35.35.0.0'.
The controller does not use a programmable FPGA.
The controller has a version number of '4' (0x00000004).
The controller has an insertion length of '0' (0x00000000).
This utility will attempt to reset the controller.
This utility has successfully reset the controller.

-----[Print the reset-command hardware log-file]-----------------------------

The scan-path will be reset by toggling the JTAG TRST signal.
The controller is the FTDI FT2232 with USB interface.
The link from controller to target is direct (without cable).
The software is configured for FTDI FT2232 features.
The controller cannot monitor the value on the EMU[0] pin.
The controller cannot monitor the value on the EMU[1] pin.
The controller cannot control the timing on output pins.
The controller cannot control the timing on input pins.
The scan-path link-delay has been set to exactly '0' (0x0000).

-----[The log-file for the JTAG TCLK output generated from the PLL]----------

There is no hardware for programming the JTAG TCLK frequency.

-----[Measure the source and frequency of the final JTAG TCLKR input]--------

There is no hardware for measuring the JTAG TCLK frequency.

-----[Perform the standard path-length test on the JTAG IR and DR]-----------

This path-length test uses blocks of 64 32-bit words.

The JTAG IR instruction path-length was not recorded.

-----[Perform the Integrity scan-test on the JTAG IR]------------------------

This test will use blocks of 64 32-bit words.
This test will be applied just once.

Do a test using 0xFFFFFFFF.
Scan tests: 1, skipped: 0, failed: 0

-----[An error has occurred and this utility has aborted]--------------------

This error is generated by TI's USCIF driver or utilities.

The value is '-150' (0xffffff6a).
The title is 'SC_ERR_FTDI_FAIL'.

The explanation is:
One of the FTDI driver functions used during
configuration returned a invalid status or an error.

[End: Texas Instruments XDS100v2 USB Debug Probe_0]

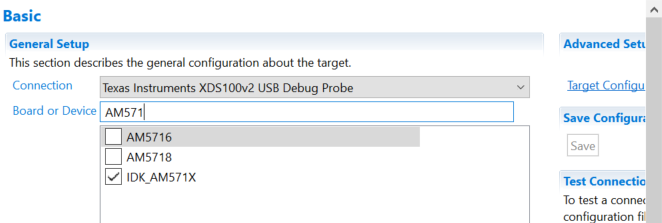
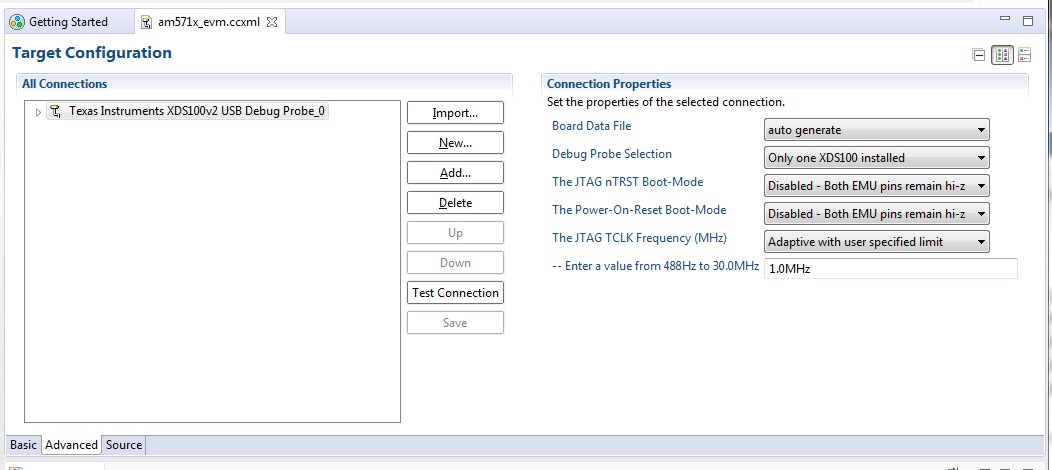
CCS shows an error message like these.My configuration &test connection result is shown above.How we configure  to resolve these error?.

  • Hi,

    Thanks for sending a very thorough post.

    I see a few problems in your setup:

    1) the AM57x family of devices uses fixed JTAG clock, but your target configuration file shows the parameter "The JTAG Clock Frequency" as Adaptive. Change it to "Fixed default 1.0MHz Frequency" and it should get rid of error 150.

    2) To connect to cores other than the device's master core (Cortex A15s in the case of AM57x devices), usually you need a GEL script to release them from reset. This GEL script is usually pre-populated if you select a board such as the IDK_AM571X in your target configuration file - shown in the picture below.

    HOWEVER, if you only need to connect to a system with pre-running code (such as Linux, for example), then select the "pure" device instead - the AM5718 in the picture above. 

    Hope this helps,

    Rafael

  • Anonymous
    0 Anonymous in reply to desouza
    I changed my target configuration as per you mentioned here.But the same error is repeated again.
  • Hi,

    I see you are trying to connect to the IVA accellerator ARM9_ICONT0, is that what you intend to do? The reason of my question is that I can reproduce the same scenario if I try to connect to this core before connecting to the master CortexA15_0 (which releases this core from reset). Check the short clip below.

    Hope this helps,

    Rafael

  • Anonymous
    0 Anonymous in reply to desouza

    All these are successfully done with on board emulator...thank you Rafael....When i trying to connect with an external emulator (XDS200 USB) it shows an error message like these.how we rectify these problem?

    IcePick_D: Error initializing emulator: (Error -2083 @ 0x0) Unable to communicate with the debug probe. Confirm debug probe configuration and connections, reset the debug probe, and retry the operation. (Emulation package 8.0.903.4

    //Target configuration is..

    //My test connection result is

    [Start: Texas Instruments XDS2xx USB Debug Probe_0]

    Execute the command:

    %ccs_base%/common/uscif/dbgjtag -f %boarddatafile% -rv -o -S integrity

    [Result]

    -----[Print the board config pathname(s)]------------------------------------

    C:\Users\BCG\AppData\Local\TEXASI~1\CCS\

    ti\0\0\BrdDat\testBoard.dat

    -----[Print the reset-command software log-file]-----------------------------

    This utility has selected a 560/2xx-class product.

    This utility will load the program 'xds2xxu.out'.

    E_RPCENV_IO_ERROR(-6) No connection: DTC_IO_Open::dtc_io

    Failed to open i/o connection (xds2xxu:0)

    An error occurred while soft opening the controller.

    -----[An error has occurred and this utility has aborted]--------------------

    This error is generated by TI's USCIF driver or utilities.

    The value is '-250' (0xffffff06).

    The title is 'SC_ERR_ECOM_EMUNAME'.

    The explanation is:

    An attempt to access the debug probe via USCIF ECOM has failed.

    [End: Texas Instruments XDS2xx USB Debug Probe_0]

  • Hi,

    Error 2083 is explained in the reference below (just search for the error code), together with several troubleshooting tips.
    dev.ti.com/.../

    In general it indicates a problem between the host PC and the Debug Probe, thus make sure you have everything properly instantiated in the Control Panel and the USB connections are stable.

    Hope this helps,
    Rafael