Part Number: DRA744
Tool/software: Code Composer Studio
Hi,
As my issue is not resolved yet by TI. I am trying different way to profile my code for different way of optimizing.
I am using a simulator of CCS V5 in current CCSV8.
I have created a simulator project and its successfully running in Simulator. But I can't profile.
I am using the target configuration c66x megamodule little endian Attached.
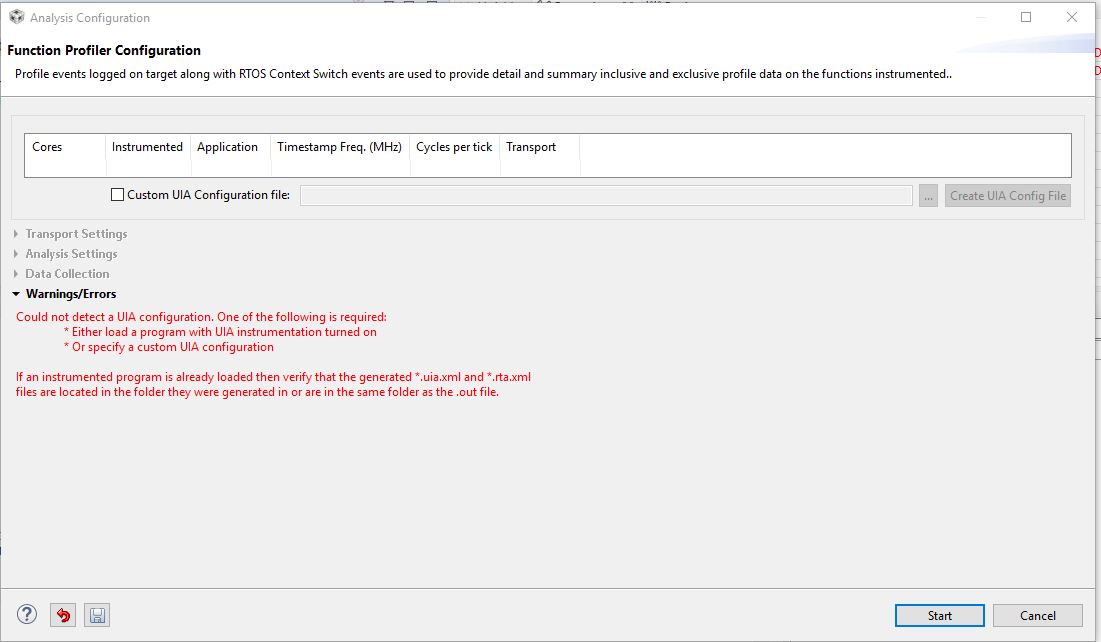
When I try to enable Function profiler I get the below error screen about UIA configuration.
How do I get this file or can anyone tell me how to profile the code in Simulator?
Thanks and Regards,
Jeeva
<?xml version="1.0" encoding="UTF-8" standalone="no"?>
<configurations XML_version="1.2" id="configurations_0">
<instance XML_version="1.2" desc="C66x Megamodule Cycle Accurate Simulator, Little Endian" href="configurations/tisim_c66x_mem.xml" id="C66x Megamodule Cycle Accurate Simulator, Little Endian" xml="tisim_c66x_mem.xml" xmlpath="configurations"/>
<configuration XML_version="1.2" description="Simulates the C66x core and the cache system in a cycle accurate manner. Supports a flat memory system. Does not model any peripherals. Use this configuration for Megamodule level applications development and benchmarking, for any C66x based device. Note on other configurations for this processor: * Use the device configurations for applications development / benchmarking that involve modules beyond the Megamodule. * Use the C66x CPU Cycle Accurate simulator for core level algorithm development / benchmarking as this will be faster than the other configurations." id="C66x Megamodule Cycle Accurate Simulator, Little Endian">
<connection XML_version="1.2" desc="C66x Megamodule Cycle Accurate Simulator, Little Endian_0" id="C66x Megamodule Cycle Accurate Simulator, Little Endian"/>
</configuration>
</configurations>