Other Parts Discussed in Thread: EK-TM4C129EXL
Tool/software: Code Composer Studio
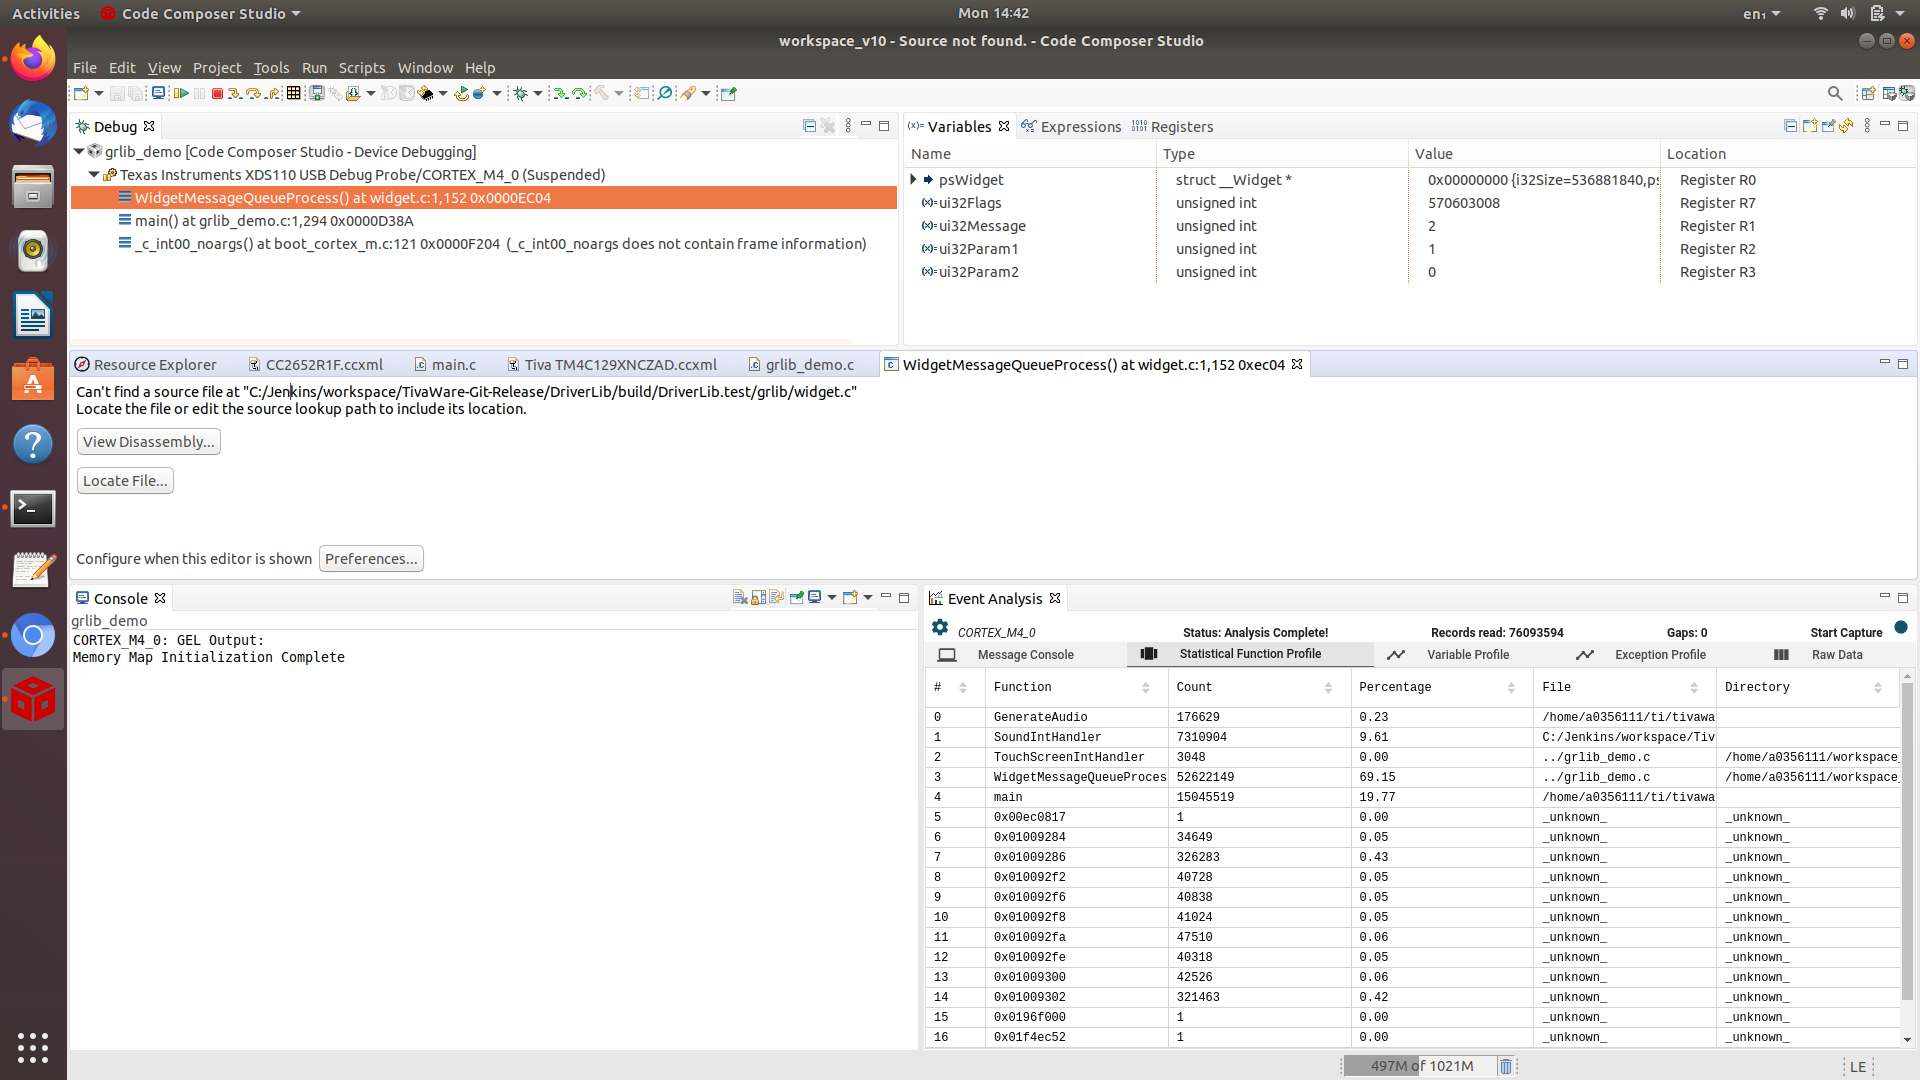
When using CCS 10.0.0.00010 under Ubuntu 18.04.4 LTS I have found that attempting to use SWO trace Event Trace is causing CCS to crash.
This is using:
- A TM4C129XNCZAD target
- A XDS110 or XDS200 probe
- Using Exception Profiling or Statistical Function Profiling
- TI Emulators 9.2.0.00002
Note that the crash is intermittent, in that can start/stop the Event Trace multiple times before CCS crashes.
The attached 0b3aa3ab-4c32-d701-55993aba-3fd18604.zip was a crash with a XDS110 and the 0118e34b-0c9e-233c-28ee01a9-468830d9.zip was a crash with a XDS200.
0118e34b-0c9e-233c-28ee01a9-468830d9.zip0b3aa3ab-4c32-d701-55993aba-3fd18604.zip