This thread has been locked.

If you have a related question, please click the "Ask a related question" button in the top right corner. The newly created question will be automatically linked to this question.

CCS: TMDSEMU110-U debugger

Other Parts Discussed in Thread: TMDSEMU110-U, TMS570LS0432, LAUNCHXL-TMS57004, RM48L952, HALCOGEN, LAUNCHXL2-570LC43, RM42L432, RM46L852, SEGGER

Tool/software: Code Composer Studio

Hello TI team,

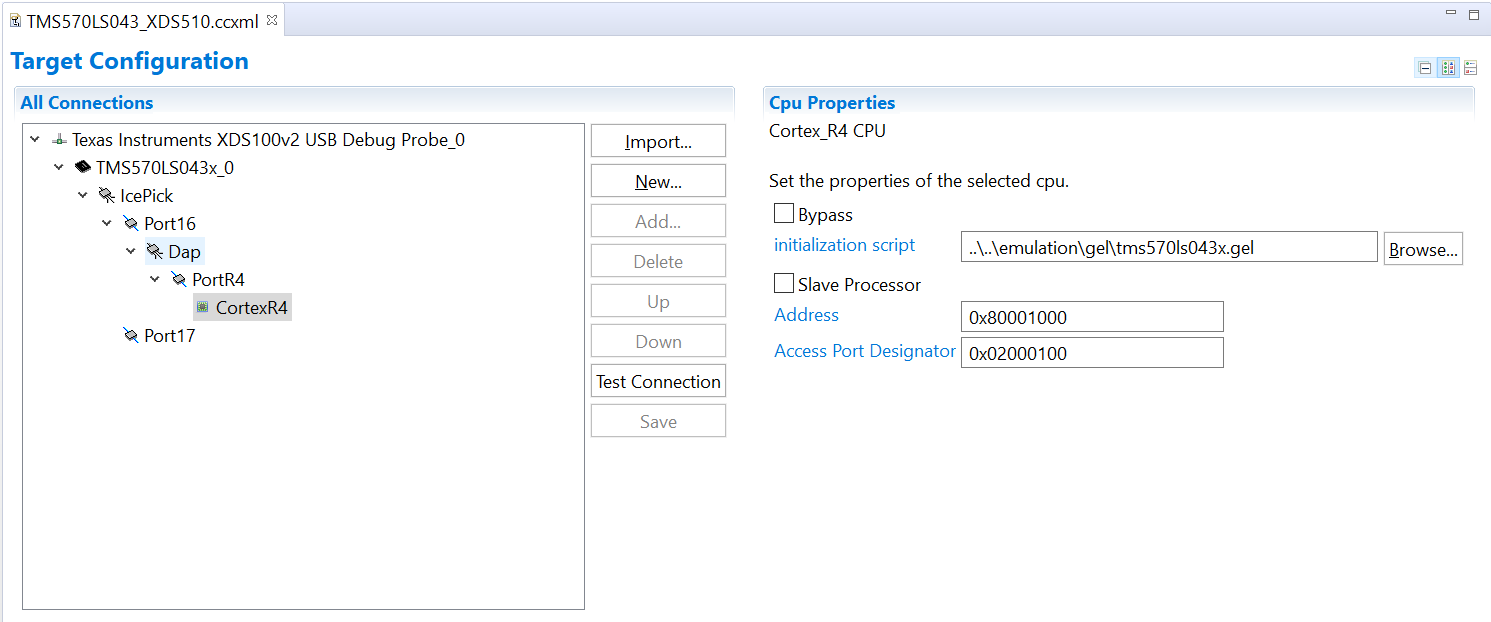
I'm using CCS10, MS570ls0432 and TMDSEMU110-U debugger. The debugger mode is JTAG. The debugger firmware has been automatically updated to 3.0 when I start debugger process. 

I add a global variable in the expression window, when the program is running the global variable hasn't been updated periodically even with the continuous refresh pressed. The variable only can be updated if I press the pause button or program hit breakpoints. When I use the TMS570ls0432 demo board with onboard debugger, the debugger will continuously refresh the global variable in the expression window when the program is running. Please give some suggestion. Thanks.

  • Hi,

    If you are using the LAUNCHXL-TMS57004, it uses a XDS100v2 Debug Probe which is currently faster than the XDS110 on Cortex R cores. For benchmark results, check the JTAG Benchmarks page at: 

    https://software-dl.ti.com/ccs/esd/documents/application_notes/appnote-debug_probe_performance_results.html

    To that effect, work is being done to improve the performance of these cores when used with the XDS110 and you should seem some improvements in the August release of the Emulation software package. This is reported on the enhancement report EXT_EP-8977 (check its status in the SIR link on my signature below).

    Best regards,

    Rafael

  • desouza said:
    To that effect, work is being done to improve the performance of these cores when used with the XDS110 and you should seem some improvements in the August release of the Emulation software package.

    I read Judy's issue as a functional issue, rather than a performance issue.

    I.e. with a XDS100v2 continuous refresh of global variables worked when the program was running, but didn't work when a XDS110 was used.

    While I don't have a TMS570LS0432 which I can connect to a XDS110, was going to try and replicate the issue with a RM48L952.

  • Chester Gillon said:
    While I don't have a TMS570LS0432 which I can connect to a XDS110, was going to try and replicate the issue with a RM48L952.

    With a RM48L952, and using CCS 10.0.0.00010 with TI Emulators 9.2.0.00002 I can't repeat the problem. The CCS Expression view was able to continuously update the value of a global variable when the program was running when used any of the following debug probes:

    • XDS100v2
    • XDS110
    • XDS200

  • Hi Rafael,

    Thanks for your reply.

    Yes, the launch board uses the XDS100v2 on board debugger. Our customer board uses JTAG interface. I read the link you sent, do you mean XDS110 JTAG on Hercules MCU isn't support the live view update now? And this feature will be updated in August? Thanks

  • Hi Chester,

    That is my problem, it is function not performance. I'm using the same software version, but MCU is TMS570ls0432.

  • Hi Chester,

    I attached the screenshots and debugger connection log.The first screenshot shows no updates when program is running and the contentiously refresh pressed. The second one shows the data has been updated if I press the pause button or program hits breakpoints. Thanks.

    8446.testBoard.dat

  • judy zhu said:
    The first screenshot shows no updates when program is running and the contentiously refresh pressed.

    In the past when have had issues with continuous refresh not working when the target was running got an error displayed such as "execution state prevented access".

    However, in your case no error is displayed.

    Can you try capturing the CCS Debug Server Logs for the working case (with a XDS100v2) and the failing case (with a XDS100)?

    The Debug Server Logs might show the issue.

  • Hi Chester,

    I attached the log(with a XDS110), this board is customer board, it only has JTAG interface, it doesn't have XDS100v2. Thanks.

    debugFail_log.zip

  • judy zhu said:
    I attached the log(with a XDS110), this board is customer board, it only has JTAG interface, it doesn't have XDS100v2.

    Looking at the log I can see that GTI_READMEM_WITH_STAT calls while the target are running don't return an error. E.g.:

    0x00003940 61080 3 CortexR4 POLL C: Polling with state STATE_READ and status EVENT_DSP_RUN
    0x00003940 61080 3 CortexR4 GTI C: GTI_READMEM_WITH_STAT( 0x000002B7AC3DE2E0, 0x08005020, 0x00000000, 0x00000004, 0x00000003, "RAM", 0x00000000, 0x00000000, *0x000002B7AD43551C = 0x000000BA, 0xFFFFFFFF, *0x000002B7AD45551C = { 0, 0x00000000 } )
    0x00003940 61081 3 CortexR4 GTI R: GTI_READMEM_WITH_STAT( 0x000002B7AC3DE2E0, 0x08005020, 0x00000000, 0x00000004, 0x00000003, "RAM", 0x00000000, 0x00000000, *0x000002B7AD43551C = 0x000000BA, 0xFFFFFFFF, *0x000002B7AD45551C = { 0, 0x00000000 } ) = 0x00000000

    Which explains why the CCS Expression view doesn't report an error.

    judy zhu said:
    I attached the screenshots and debugger connection log.The first screenshot shows no updates when program is running and the contentiously refresh pressed.

    What I have noticed from your first screenshot, and the debug server log, is that when the target is running the XDS110 returns the hex value "0xBAD0" for the target memory. From a quick search I think that the value "0xBAD0" means the memory read failed for some reason n, but at the moment not sure at what point the error occurred (e.g. in the CCS Debug Server or XDS110 probe).

  • Hi Chester,

    I have two XDS110 probes received last week. I tried both, it is same issue.  I also tried to reinstall CCS 10, but no luck. Is this issue related to MCU memory lock? How to unlock it? Thanks!

  • judy zhu said:
    Is this issue related to MCU memory lock?

    I haven't been able to determine what could cause the XDS110 to return a data value of 0xBAD0 while the target is running. I am hoping that Rafael or someone else at TI will be able to determine the significance of that.

    What due do you mean by "memory lock"?

    Is your running program enabling the MPU or any other protection mechanism?

  • Hi Chester,

    Thanks for your support. I don't enable any MPU function in program. We use FreeRTOS which codes generated by Halcogen.

    Here is our debugger interface. Could you please review it. Thanks!

  • judy zhu said:
    Here is our debugger interface.

    My only comment is the 10K R206 between 3.3V and P6 pin 5 which is VTRef for the emulator looks high. The recommendation from Emulation and Trace Headers Technical Reference Manual is to use a 100 ohm current-limiting resistor between the target supply and VTRef. However, given that the only issue with the XDS110 is continuous refresh not working the value of R206 probably isn't the cause.

    You could also try reducing the JTAG TCLK Frequency (MHz) of the XDS110, see http://software-dl.ti.com/ccs/esd/documents/xdsdebugprobes/emu_xds110.html#debug-and-trace-usage-modes, in case has an effect.

  • Hi Chester,

    I have tried set different TCLK Frequency, but no luck. 

  • Judy,

    Please apologize for "disappearing". I agree the issue seems functional, but it may be tied to the circuit itself that may be limiting or corrupting the data transfers - the XDS100v2 and the XDS110 have different JTAG line drivers and therefore dependent on variants on the circuit itself. 

    Looking at the schematics, in addition to Chester's suggestion I would remove the resistors R203, R204, R206, R207 - they will degrade the JTAG signals. The information for this is shown not only on the LAUNCHXL-TMS57004 schematics but also on our reference design guidelines shown at the section Target Connection Design of the XDS Target Connection Guide at:

    https://software-dl.ti.com/ccs/esd/documents/xdsdebugprobes/emu_xds_target_connection_guide.html

    As a side note, I would also reduce R208 and R210 to 4.7kΩ, but that is not really related to the issue at hand. 

    In these quarantine times I have no access to my TMS570LS0432 launchpad, but my tests on the LAUNCHXL2-570LC43 did not reveal any differences between the XDS100v2 and the XDS110 Debug Probes with regards to accessing global variables on the Expressions view. I am using a HalCoGen FreeRTOS project as well. 

    One last remark: if you tag local variables on the Expressions view, keep in mind they will change their values or simply disappear depending on the debug context, thus possibly assuming bad values that try to access invalid memory locations. An explanation for the BAD0 values is shown at Chester's other thread at:

    https://e2e.ti.com/support/tools/ccs/f/81/t/914953 

    Hope this helps,

    Rafael

  • Thanks Rafael and Chester for your support. 

    We will try your suggestions

  • Chester Gillon said:
    While I don't have a TMS570LS0432 which I can connect to a XDS110, was going to try and replicate the issue with a RM48L952.

    Having got a TMS570LS0432, then with CCS 10.1 attempting to perform a continuous refresh of global variables when the program was running resulted in 0xBAD0 being displayed when used either:

    • The internal XDS100v2 on the LAUNCHXL-TMS57004
    • An external XDS100v2
    • An external XDS110
    • An External XDS200

    I remembered the previous thread Can't get CCS 6.1 "Continuous Refresh" for Memory or Expression views to work for Hercules devices where for a RM42 device continuous refresh didn't work when the target was running due to:

    One note about the difference between RM42 and RM46: RM42 does not have the functional path wired to allow access to the memory map via DAP.

    I think the TMS570LS04x devices may have the same limitation as the RM42 devices.

    The only way I could get continuous refresh to display variables while the TMS570LS0432 was running under the project properties Debug -> Auto Run and Launch Options -> Realtime Options was to enable the "Halt the target before any debugger access (will impact servicing of interrupts)" option, but that impacts realtime performance as the CCS debugger has to keep pausing and then resuming the target.

  • Chester,

    The RM42L432 is the little endian variant of the TMS570LS0432 device, which in turn is the same device as Judy's, so it certainly explains it.

    Unfortunately the small design choices implemented inside these devices are sometimes hard to track, especially because these devices clearly show a DAP on their JTAG routing (which usually allows memory access without CPU intervention). 

    Chester Gillon said:
    The only way I could get continuous refresh to display variables while the TMS570LS0432 was running under the project properties Debug -> Auto Run and Launch Options -> Realtime Options was to enable the "Halt the target before any debugger access (will impact servicing of interrupts)" option, but that impacts realtime performance as the CCS debugger has to keep pausing and then resuming the target.

    That is certainly the workaround on this case, but it is certainly detrimental to the real-time functionality. 

    Thank you,

    Rafael

  • desouza said:
    Unfortunately the small design choices implemented inside these devices are sometimes hard to track, especially because these devices clearly show a DAP on their JTAG routing (which usually allows memory access without CPU intervention). 

    I think the difference is if the AHB-AP interface on the DAP is connected on the device.

    E.g. the datasheet for TMS570LS0432 device which doesn't allow memory access while the target is running doesn't show the AHB-AP interface on the DAP:

    Whereas the datasheet for the RM46L852 which does allow memory access while the target is running does show the AHB-AP interface on the DAP:

  • Chester,

    Chester Gillon said:
    I think the difference is if the AHB-AP interface on the DAP is connected on the device.

    Nicely spotted; you are probably right given the AHB will allow high speed access through the debug port (reference), but it is still almost a "footnote" on a large document. 

    I parsed the TRM and found out the RM46x has references to the AHB and its interconnection with the VBUSM (figure 2-1 and further down the text), while the TMS570LS04x/03x is much simpler with no AHB Access Port. Regardless, on both I miss a full chapter about the Debug Subsystem (something I could probably find in a Keystone II device, for example).

    Thank you,

    Rafael

  • desouza said:
    I parsed the TRM and found out the RM46x has references to the AHB and its interconnection with the VBUSM (figure 2-1 and further down the text), while the TMS570LS04x/03x is much simpler with no AHB Access Port.

    When I went to use a Segger J-Link with a TMS570LS0432 with CCS 10.1 the following is reported in the Console every time execution stops (e.g. after a Step or hitting a breakpoint):

    CortexR4: Trouble Reading Register REG_AHB_DOWNLOAD: No mapped register was found for 1627402249

    According to the old thread CortexR4: Trouble Writing Register REG_AHB_DOWNLOAD: No mapped register was found for xxxxx :

    KGreb said:
    The error message suggests to me an issue in programming the CoreSight AHB-AP.  This debug peripheral is available on most of the TMS70LSx products except for the LS04x/LS03x.