This thread has been locked.

If you have a related question, please click the "Ask a related question" button in the top right corner. The newly created question will be automatically linked to this question.

Graphing CCS Version: 5.5.0.00077


Hi all,

I am using the graphing feature in CCS v5.5 with a C2000, it seems to work quite nicely but I have a couple of questions:

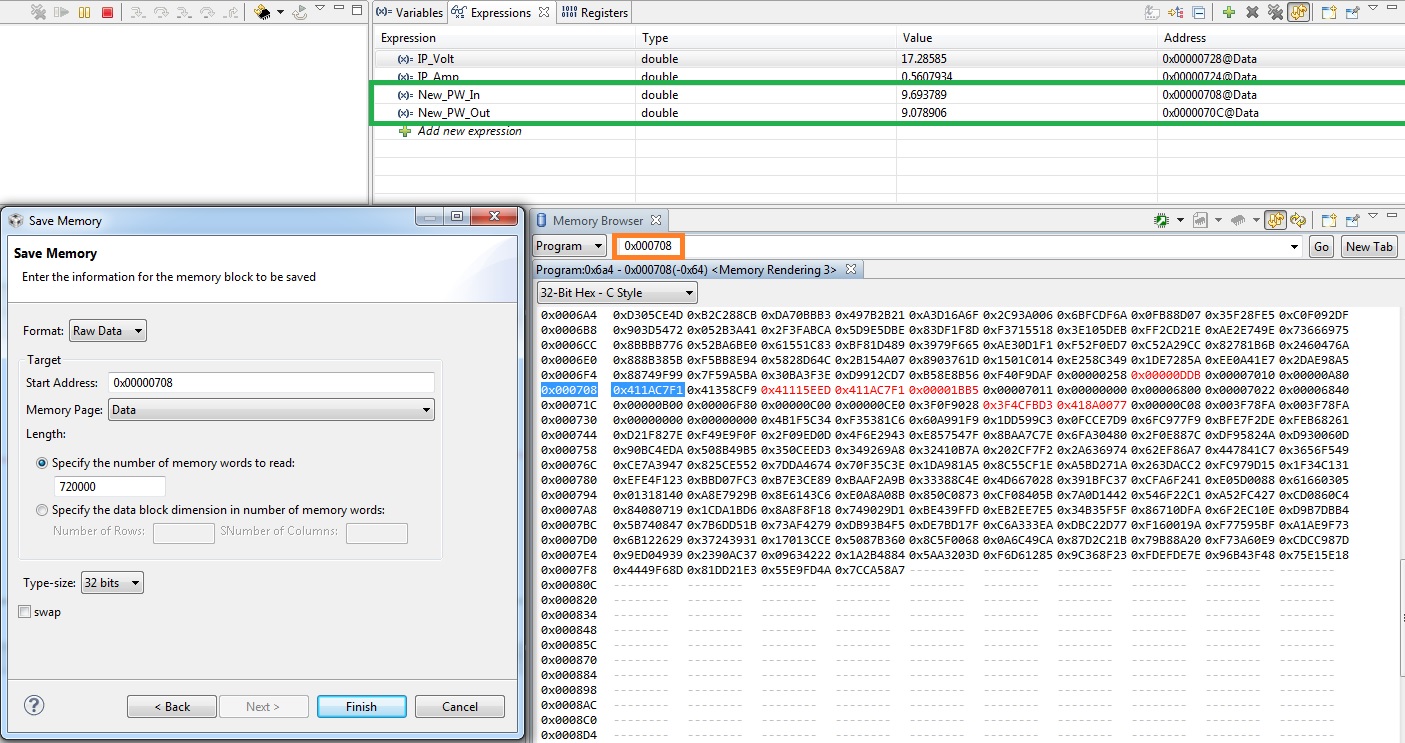
1) Currently I am taking a screenshot of the graph data and then using the cropped image of the graphs.  Is there a way to either export the raw variable data to say a spreadsheet, or the graph data.  I have tried a couple of different options but had no success.

2) How accurate is the X axis time, as I have tried a few settings on this using the mS option but the calculations I made did not match a crude method I used with my phone in stopwatch mode.  Is there a known good setting for this someone can suggest?

Best regards,

Ant

  • Ant,

    1) Check http://e2e.ti.com/support/development_tools/code_composer_studio/f/81/t/166520.aspx

    2) How are you exactly measuring this? The way I see is to have a very slow update rate in order to be able to measure it with a stopwatch (1 second or even slower).

    Regards,

    Rafael

  • Hi Rafael,

    Thanks for the link will look deeper into this first thing in the morning as later here now, but looks like this answer Q1.

    To answer your question regarding Q2, I perhaps did not make my question totally clear.

    I am using a PWM running at 25kHz, this is also used to trigger 4 ADC channels.  I have the debug set to refresh every 100mS.  I right clicked on 2 of the variables I am interested in and select graph, then in the a graph option I select mS for the X axis and set it to continuous refresh.  Then I hit the play/run button and at the same time I start my phone timer.

    After running for 2 minutes on the phone watch, I took a screen grab and then I tried to calculate the mS shown in the X axis.  This is where I had a problem as dividing 1000 into the values did not yield anything near the 2 minutes, however when I was watching the data stream hit 9000mS this correlated to 9 seconds roughly on my phone.  As I said a crude method but I was trying to make sense of the X axis, and this gives a 'ball park figure'.

    I don't have the exact screen grab now, and just wondering if there is a specific setup to get the exact time?

    Failing that I can replicate the issue with images of the settings I use and explain it a bit clearer tomorrow if this is not enough information?

    Cheers,

    Ant

  • Hi Rafael,

    Ok I have taken a couple of screen shots as having a few issues implementing the memory browser option, and have also tried to show the settings I am using for the graphing tool.

    1)  So the image below shows the memory browser screen capture, I am basically interested in storing the data from 2 variables (both doubles).  These are New_PW_In (memory address 0x00000708) and Old_PW_Out (memory address 0x0000070C), highlighted in the green box.

    I can find the memory location and view them constantly refreshing, the video link gives some indication of what to do but some of the settings are not really shown, so I am unsure if I am saving the correct information.  I also want to save roughly 10 minutes of data, and may increase this pending how I proceed.  I saved a .bin file but unsure firstly of the data content and also not found an easy way to open this yet, but that is another bridge to cross after I can get the data I want saved.

    Is there a better tutorial or some written documentation on using the memory browser to carry out the task I want to achieve, or can you provide a run through of what I need to do here?

    The image can be enlarged to read any detail that is necessary

    2) As mentioned already I have enclosed a further screen shot below. I again crudely timed 2 mins with my phone and trying to understand the units on the X axis, and how to give a meaningful value to them in relation to time?

    Regards,

    Ant