Hi,
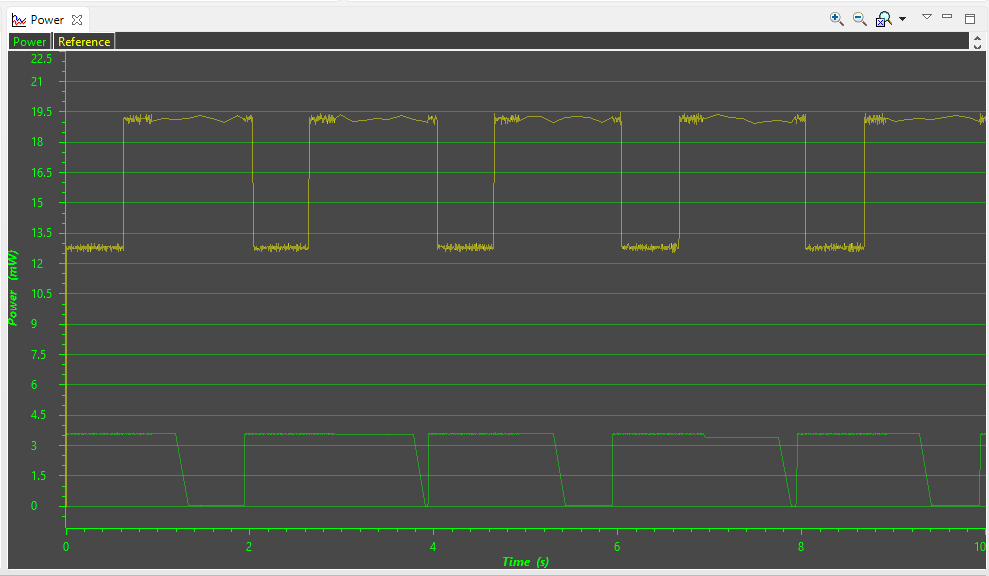
I've just noticed a problem with the way that reference profiles are plotted on the EnergyTrace Power and Energy graphs. There seems to be a horizontal scaling effect that is tied to the power consumption measured in the current energy profile.
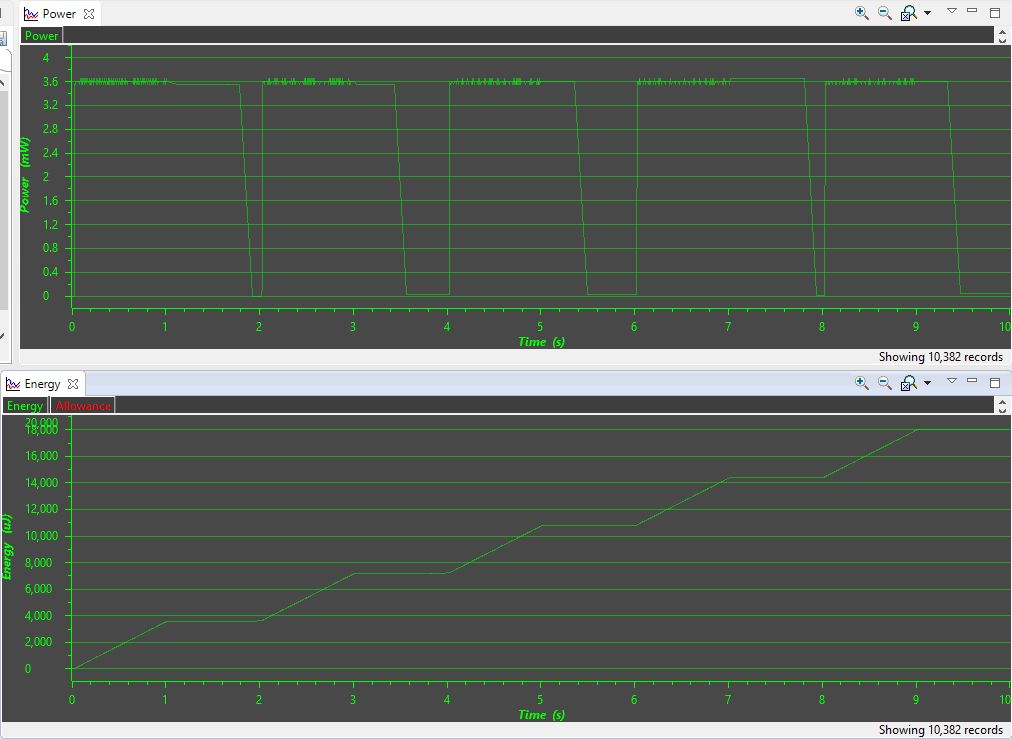
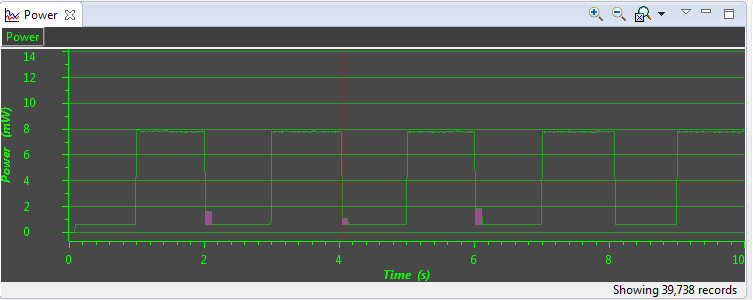
I have a reference profile which was recorded over a 10 second period while the target board flashed an LED at approx 0.5Hz. The Power graph clearly shows a square wave of ~0.5Hz due to the power consumption of the LED.
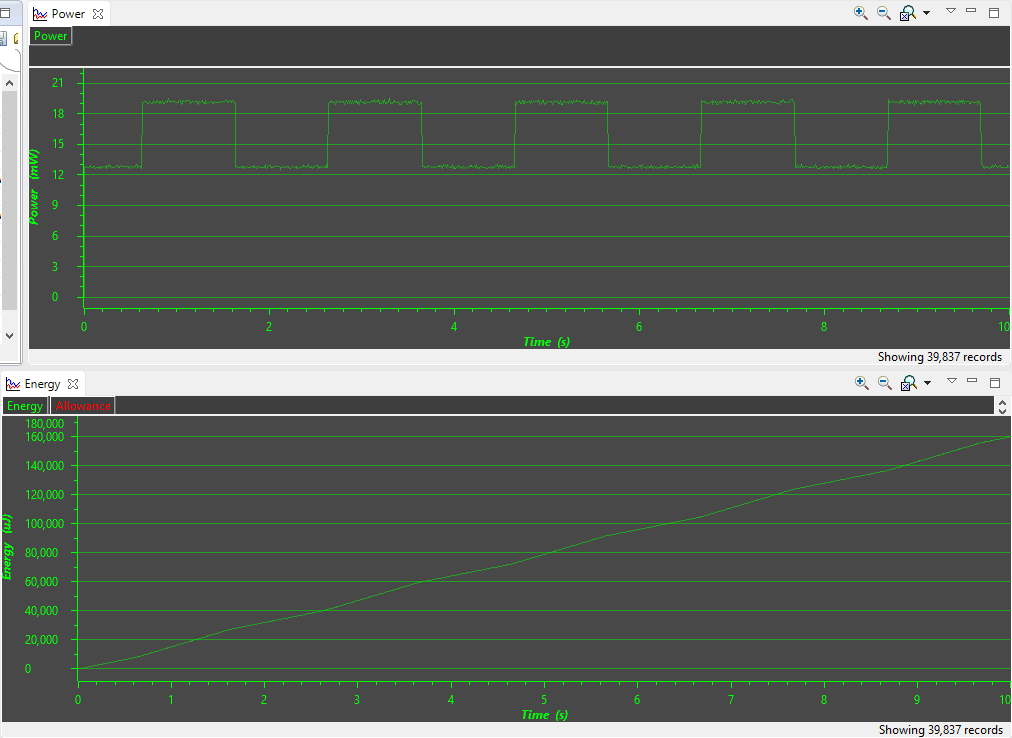
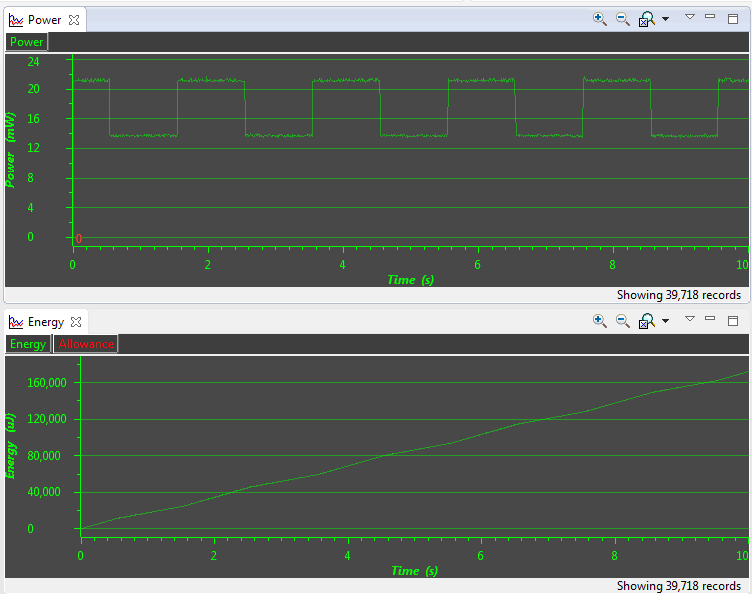
If I load this reference file and take a new capture of 10 seconds duration with relatively high power consumption the result looks like this:
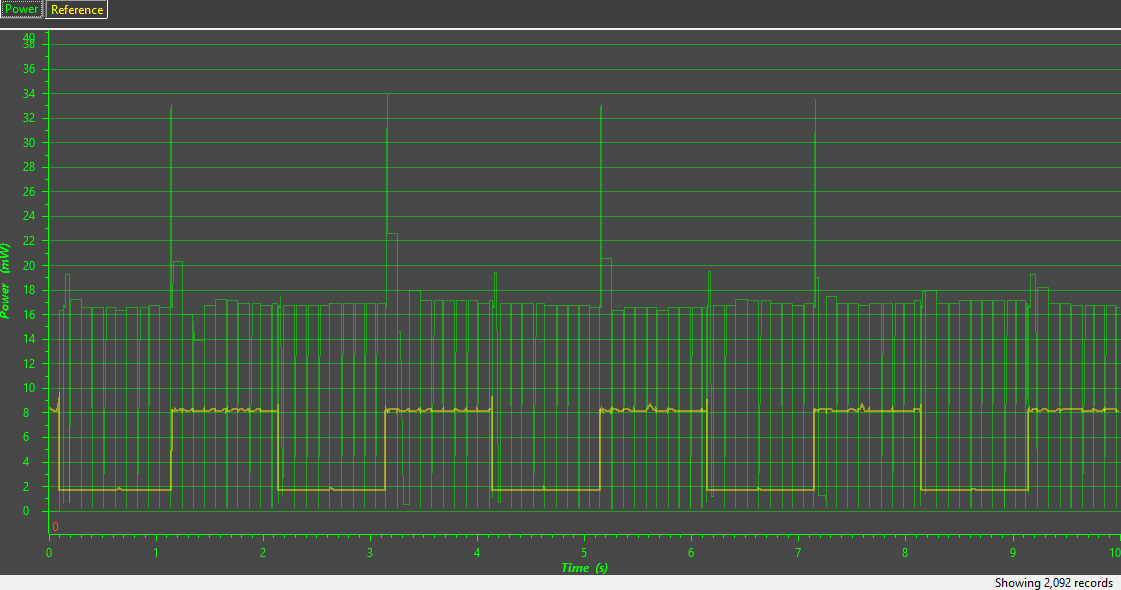
The reference Power trace looks reasonably accurate. On the Energy graph the final value for the energy used during the capture is close to that shown on the main EnergyTrace window.
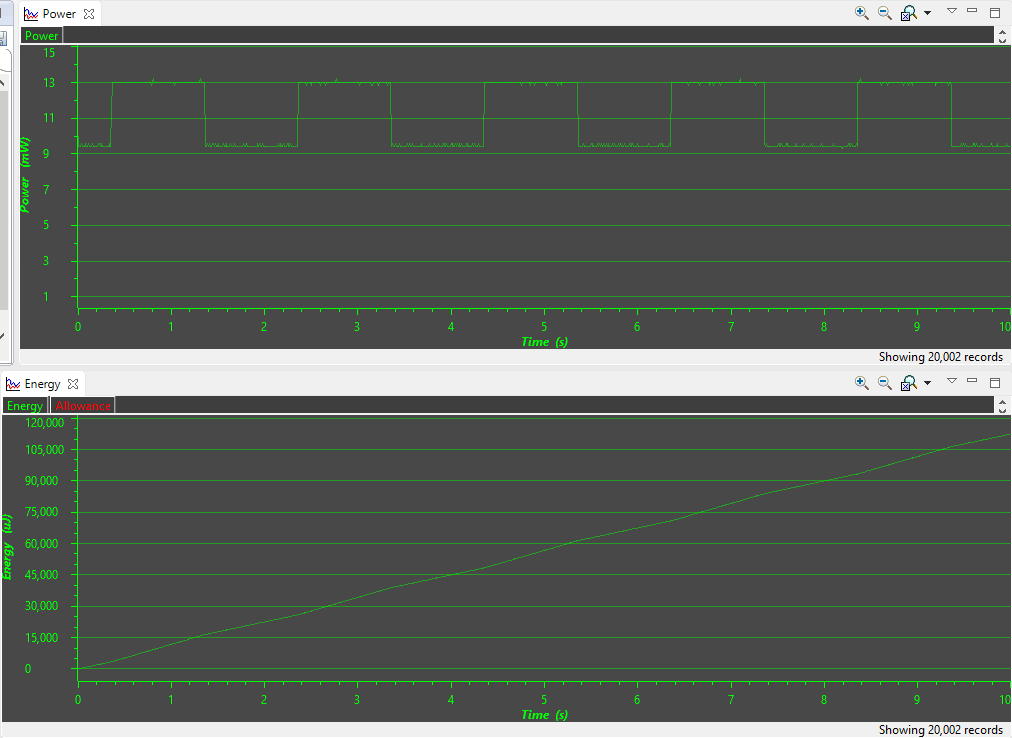
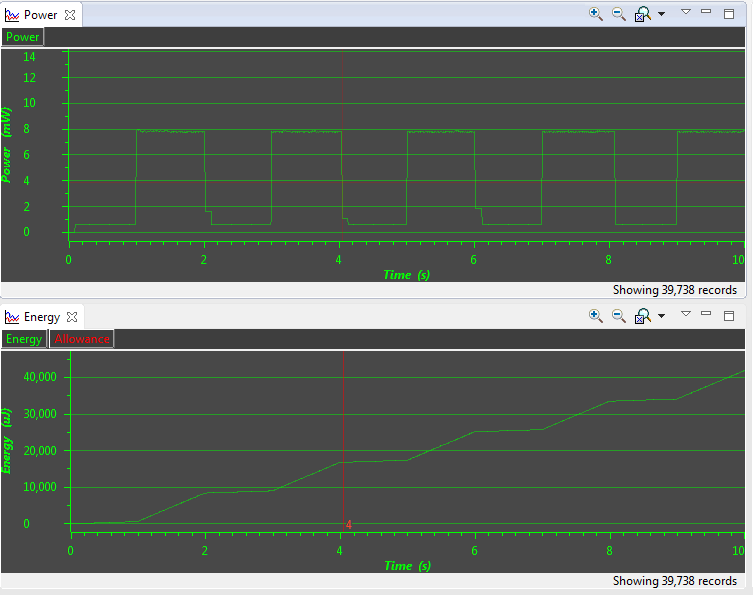
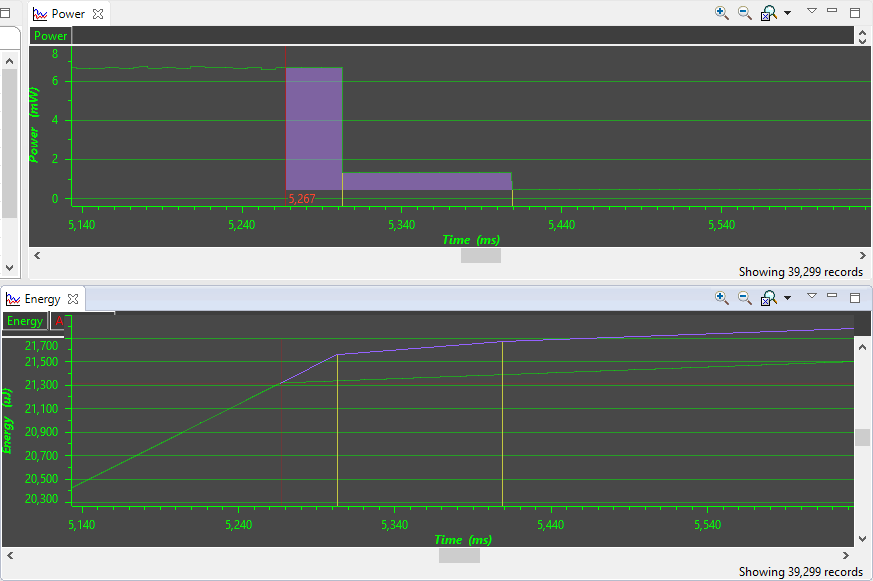
Using the same reference profile, I then took another capture where the power consumption dropped significantly at the 5 second mark:
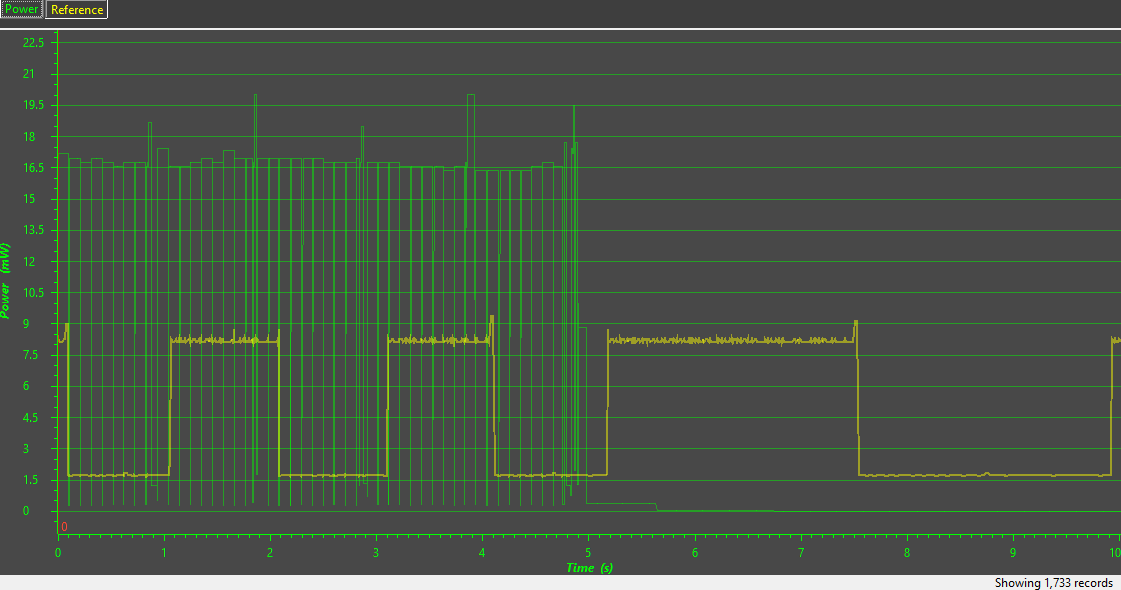
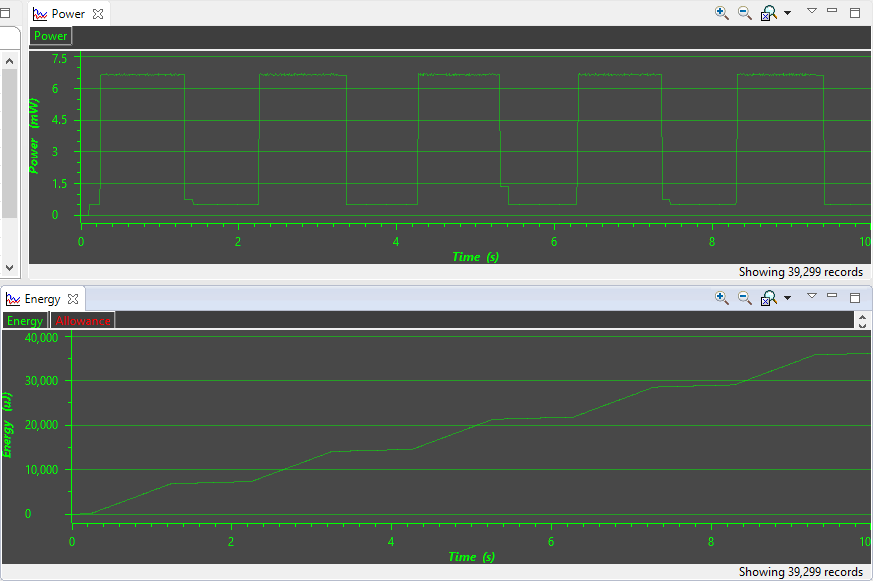
When the power consumption in the current trace falls the reference timebase is stretched and the squarewave changes from ~0.5Hz to ~0.2Hz. Also, the final point of the reference trace on the energy graph is at about 38mJ, but the main EnergyTrace window says that the total energy used over the trace is over 49uJ.
Is this a known issue?