Tool/software: Code Composer Studio
I'm working with a customer on getting SWO Trace Debug working. We believe we have correctly followed the instructions from the following wiki page:

The target config has the following settings:

The programming connector has a 10k pullup on reset and TCK:

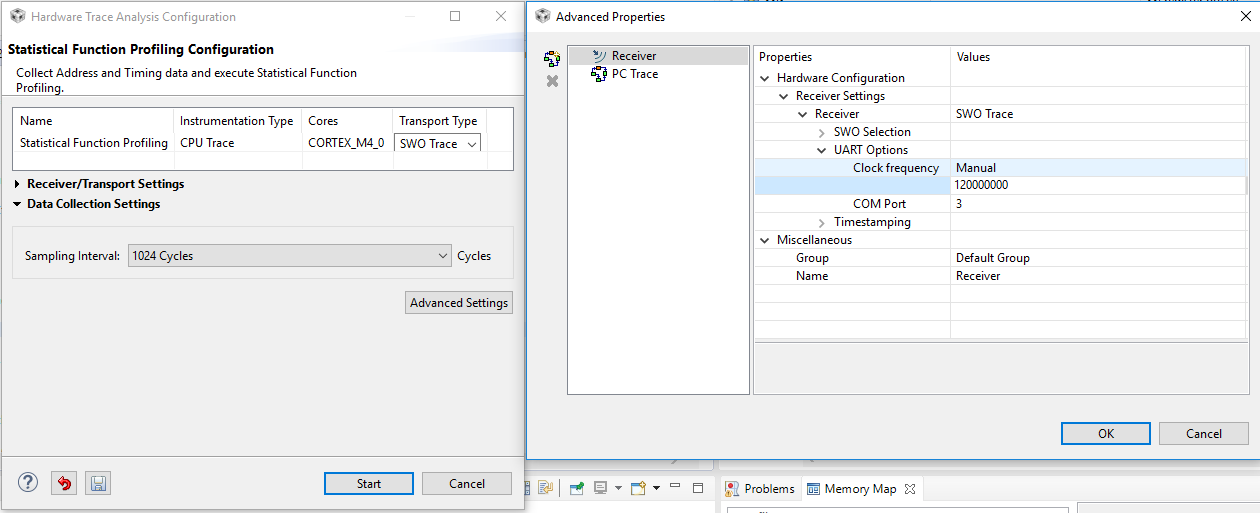
For example if trying to run interrupt profiling, we have the following settings (COM 11 is the user COM port):

And this results in the following error message:

We have tried starting the analysis both with the firmware free-running and after halting on a breakpoint after system clock initialization with the same result.
None of the other Hardware Trace Analysis features in the menu appear to work either.
We watched the TDO pin on an oscilloscope and it is stuck low when the XDS200 debugger is connected and in use. If we remove the debugger or let the board run on its own, the internal pull-up on TDO appears to pull it high. We are assuming the chip is successfully using SWD mode since we don’t see anything on TDO during programming or debug – we haven’t checked the entry sequence on TCK and TMS to confirm.
Is there something we need to do in the firmware to enable the ITM in the MCU or is there a Code Composer setting somewhere we are missing? We are using CCS 6.1.2.00015.
Thanks,
Stuart