This thread has been locked.

If you have a related question, please click the "Ask a related question" button in the top right corner. The newly created question will be automatically linked to this question.

CCS/TMDSEMUPROTRACE: testing XDS560v2 PRO TRACE link with a C6657

Part Number: TMDSEMUPROTRACE

Tool/software: Code Composer Studio

Hello,

We are using for the 1st time a XDS560v2 PRO TRACE on a 60 pin connector to debug a C6657 and I have some questions about it

1-Is there a way to test the link with the DSP from the signal integrity point of view ? (I know that lauterbach probes can do an eye diagram on ARM ETM links)

2-For a PC TRACE, why CCS let us decide the number of emu pins to use ? What is the consequence of using more or less pins ?

3-Is it possible to save a PC TRACE on hard disk for future analysis ? What is the space needed per minute of recording ?

Regards,

David

  • David,

    1. The XDS ProTrace automatically performs a handshake and evaluates a reasonable throughput based on the signal integrity received by the pod. We don't have a "test mode" where a pattern is continuously sent so an oscilloscope can be hooked up and display an eye pattern. 

    2. The number of pins is directly dependent on the hardware - some boards or devices only have a limited number of pins, thus the setting enables the ProTrace work on these scenarios. As a general statement, the more pins the better - it avoids data collection gaps ("blind time"), especially in fast processors. 

    3. Yes. When the data is captured, it can be saved in .csv or .tdf file formats. The .tdf file format can only be read back by the Trace Viewer in CCS. To export in .csv, simply right-click on the view, then select Data --> Export All

    The size of files greatly varies with the selected buffer size, the processor speed, the number of selected columns (for .csv). 

    Hope this helps,

    Rafael

  • Thank you for the information provided Raphael, just a few more questions about robustness :

    1-In the transmission process, is there a CRC or alike which can indicate a transmission error instead of showing wrong data ?

    2-Does "collection gaps" are indicated ?

    Regard,

    David

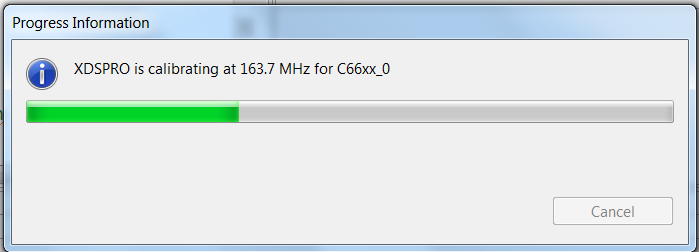
  • 3-Does the handshake you talk about corresponds to this calibration ?

    Regards,

    David

  • David,

    1 - It's been a while since I looked at the spec but, given the high data rate involved when this was created, CRC was not implemented on the trace data transfers. (I couldn't find anything confirm

    2 - Yes, data gaps are indicated in the raw trace data view. 

    3 - Yes, the calibration is the handshake and signal integrity tests. 

    There are a few interesting documents shown in the section References on the XDS Target Connection guide at:

    https://software-dl.ti.com/ccs/esd/documents/xdsdebugprobes/emu_xds_target_connection_guide.html

    The most recent document is the SPRU655 (the first one)

    Hope this helps,

    Rafael