This thread has been locked.

If you have a related question, please click the "Ask a related question" button in the top right corner. The newly created question will be automatically linked to this question.

WEBENCH® Tools/IWR6843AOPEVM: mmwave IWR6843AOP EVM mmwave_industrial_toolbox_4_0_1 area scaner lab

Part Number: IWR6843AOPEVM
Other Parts Discussed in Thread: UNIFLASH, IWR6843AOP

Tool/software: WEBENCH® Design Tools

Hi i am using the mmwave industrial toolkit and i am facing an issue to run the area scaner lab. 

after running the mmw_arae_scanner i got this : 

Sending configuration from C:\ti\mmwave_industrial_toolbox_4_0_1\labs\area_scanner\68xx_area_scanner_v1\chirp_configs\mmw_area_scanner_68xxAOP.cfg file to IWR16xx ...
% ***************************************************************
Warning: Unexpected Warning: A timeout occurred before the Terminator was reached.
Warning: Unsuccessful read: The specified amount of data was not returned within the Timeout period..
% Created for SDK ver:03.02

Waiting long time i got several waring then command line and i am block to initialize log: C:\ti\mmwave_industrial_toolbox_4_0_1\labs\area_scanner\68xx_area_scanner_v1\gui\log_data.csv

the flashing seems to be correst the port com are good one since the communication is started but unfortunatly no plot on the 3D display 

Do you have any idea about my misstake? 

thanks a lot 

reynald 

  • Also ... 

    I did the reset and the SOP2 is set to OFF for functionnal mode.

    thanks and regards 

  • Former Member
    0 Former Member in reply to reynald pireyre

    Hello,

    This kind of response usually does indicate that there is an issue with the communication either the COM ports or the SOP mode. If you are sure that you have that correct can you verify if using the standard visualizer works without issue?

    https://dev.ti.com/gallery/view/mmwave/mmWave_Demo_Visualizer_IWR6843AOP/ver/1.0.0/

    Amanda

  • You fully right but i wondering why the connection doesn't work anymore ... 

    I played a lot with the demo without any problem this week and now the data port doesn't connect. 

    do you have any advice ? 
     

    an other thing i am not able the flash again the product. ... 

    thanks and regards

    reynald 

  • the flashing is working ... 

    but using the demo visualize the CFG port is working and the DATA port doesn't ... 

    do i need to reflash the demo code into the board ? 

    reynald 

  • and sure the "send config to mmwave device " doesn't work ... 

    the log is here : 

    CFG_port_transport: Hardware Connected.
    DATA_port_transport: waiting for data ...
    CFG_port_transport: waiting for data ...
    DATA_port_transport: connecting to COM11:921600
    CFG_port_transport: connecting to COM10:115200
  • Former Member
    0 Former Member in reply to reynald pireyre

    You should not need to reflash the demo until you want to change to a different demo.

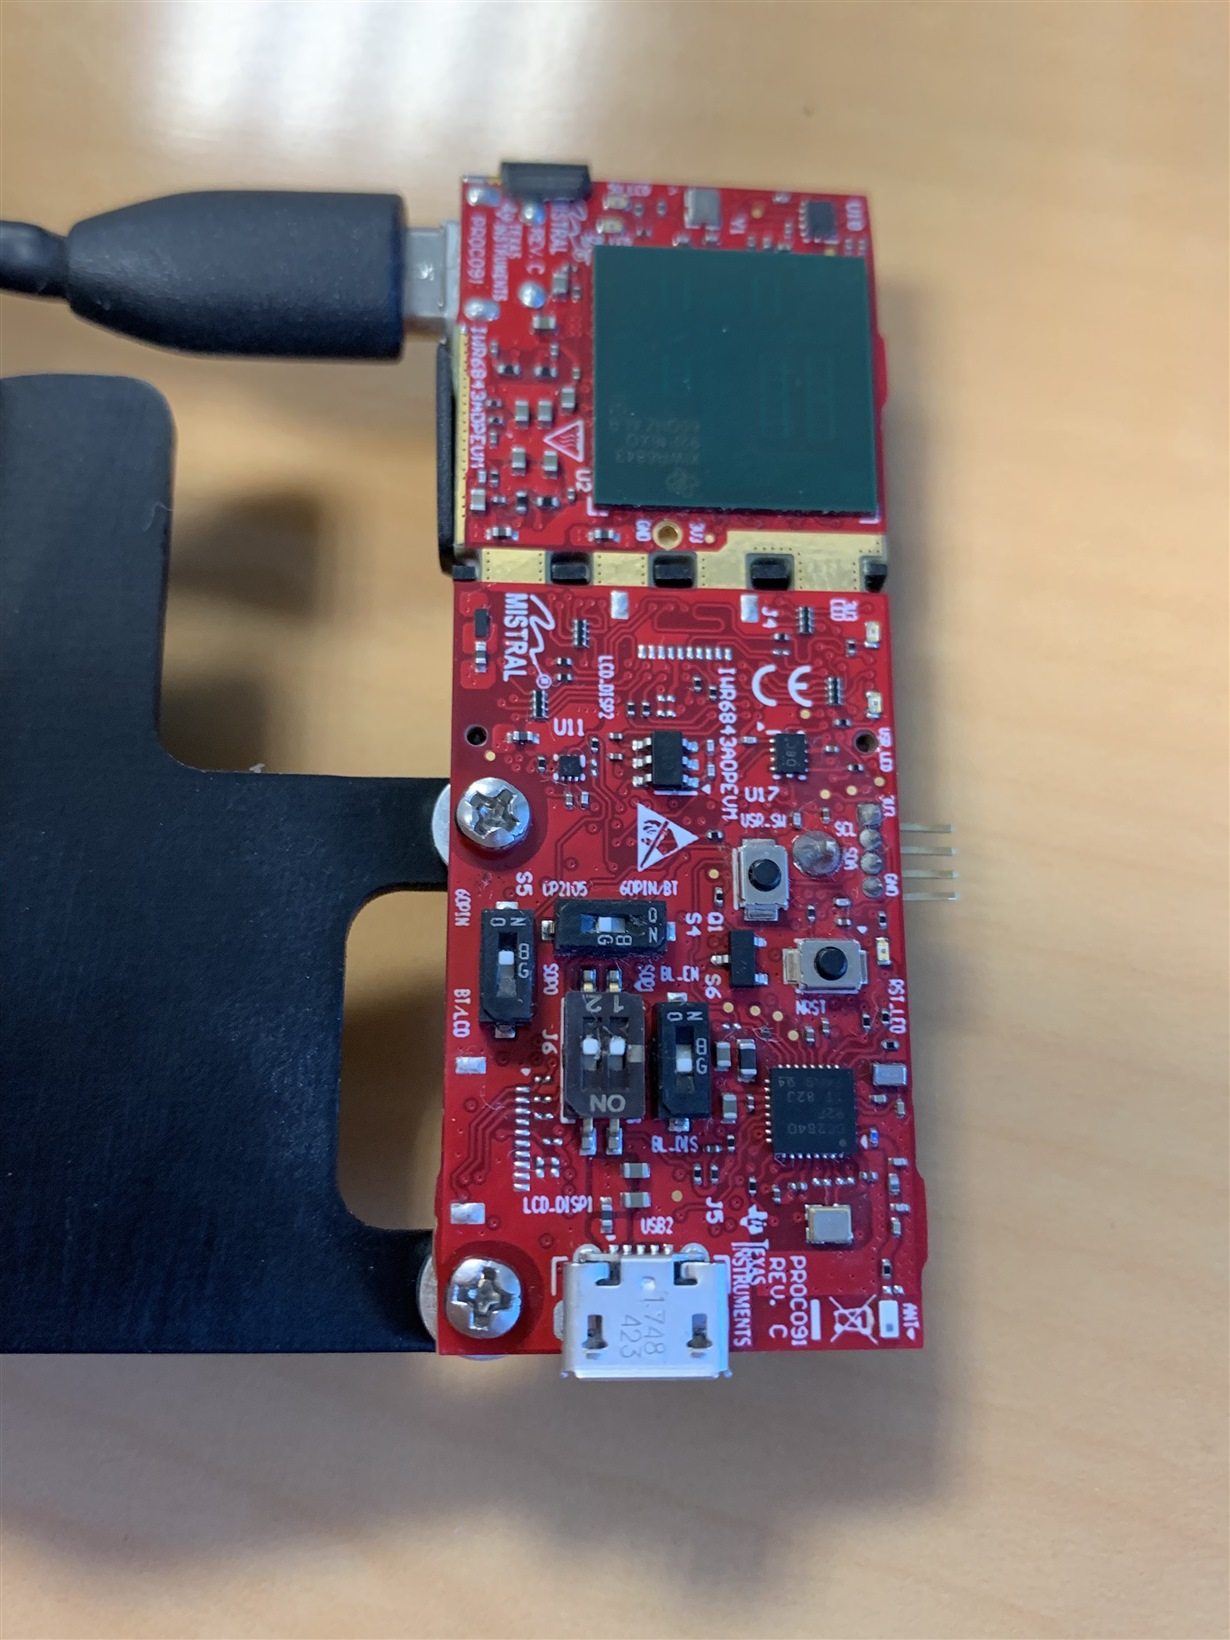
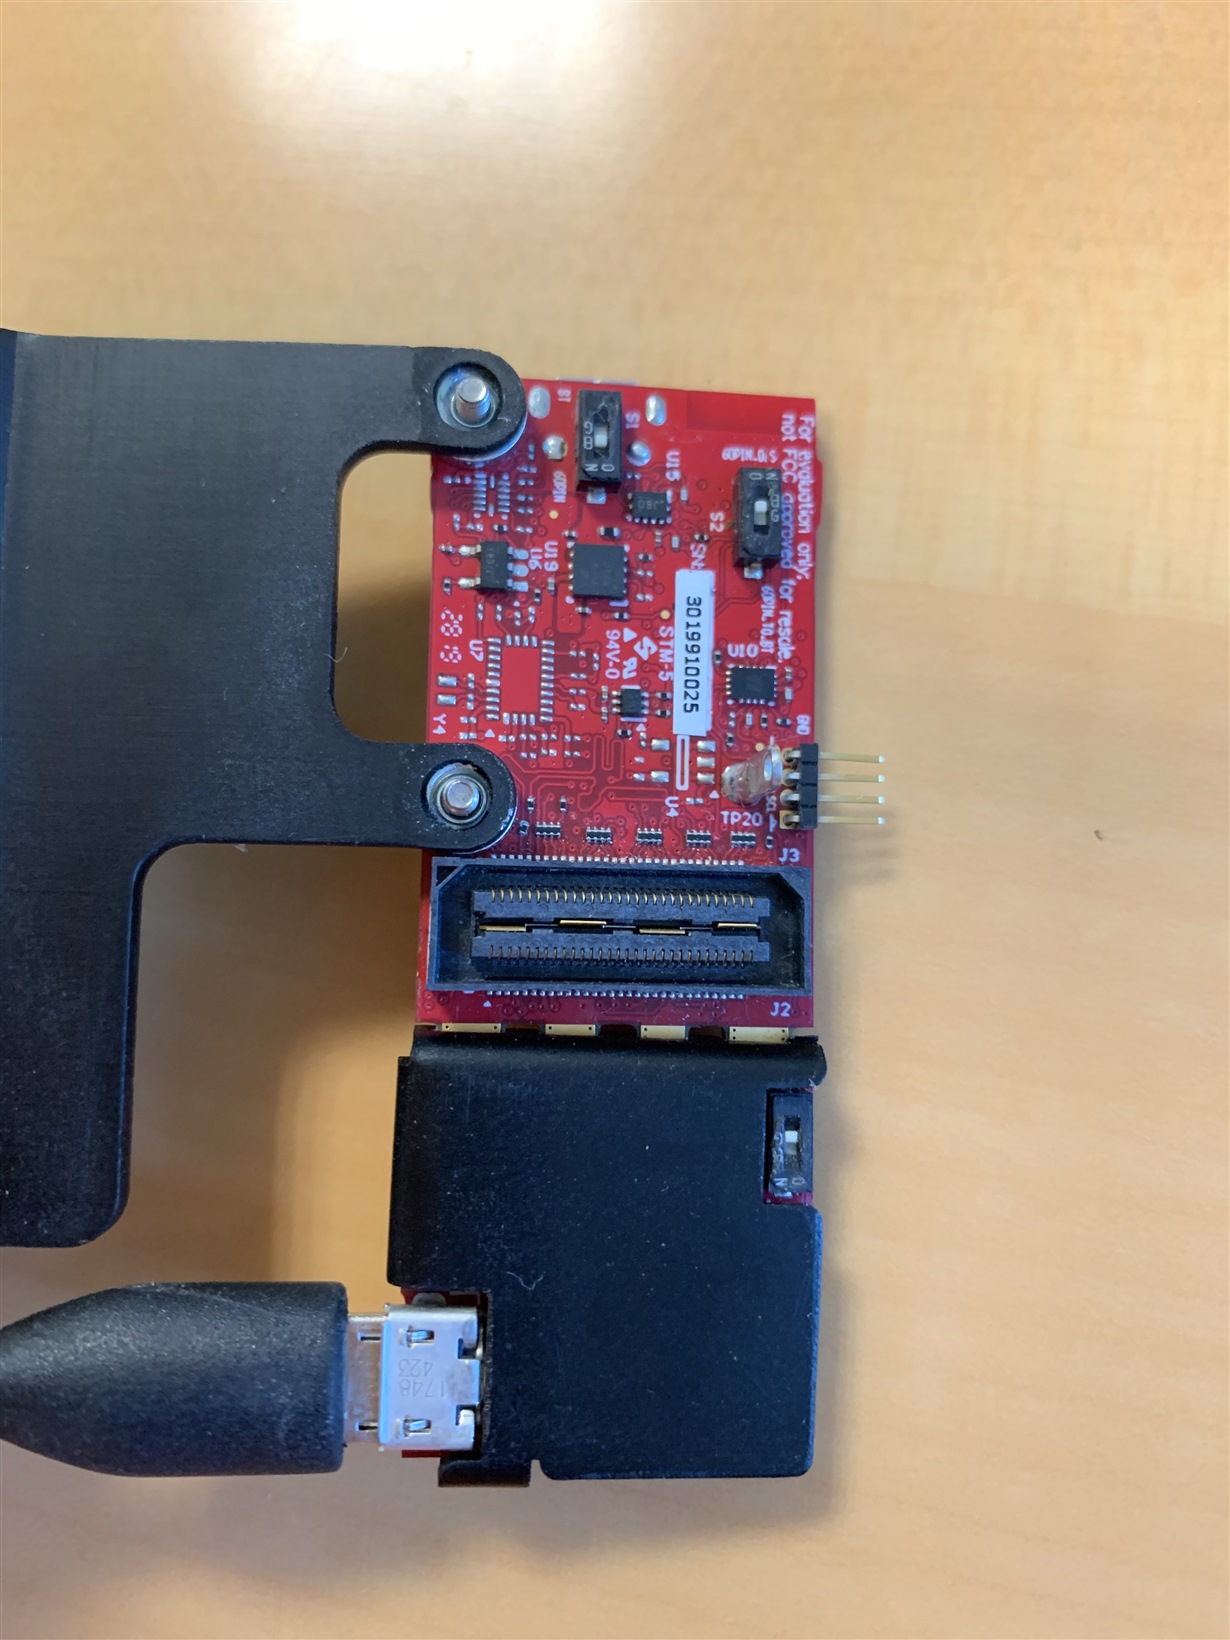
    Can you provide pictures of your switch settings (front and back of the EVM)?

    Also please open up a terminal such as tera term and connect to the CFGport @ 115200. Hit the return key. You should see mmdemo:>/ appear. Type version. Please paste back the output.

    Amanda

  • Here are the picture 

    will go through the terminal and come back 

    thanks

    reynald 

    thx 

  • i don't have any output using the terminal (windows linux same) 

    reynald 

  • Former Member
    0 Former Member in reply to reynald pireyre

    Hello Reynald,

    Can you please check that you have downloaded the latest industrial toolbox and are flashing the .bin from the out of box demo for 6843 AOP?

    Please see this thread for more details: IWR6843AOPEVM: mmWave Demo Visualizer can't connect to data port

    Amanda

  • Hi, 

    So good news, now the demo work again. the problem i had was about the serial port i have to unplug/plug the usb before restarting the demo. 

    unfortunatly the area scanner doesn't work i have same behaviour. 

    After loading the full mmw_area_scanner_68xxAOP.cfg i got sensorstart and nothing 

    btw still have the warning and the time out ... also it is very long to load ... 

    Do i need to change the baud rate of the UART COM and DATA COM? 

    Do i need to start something or as soon as the cfg file is loaded it should work ? 

    thanks 

  • i changed the baud rate has you propose, using ter term 

    but i did received any prompt. 

    This becomes critical i have make a status on the mmw technologie for our project and i am not able to run the lab ... 

    could we have a teamviewer session  ?

    thx

    reynald 

  • I tryed terTerm acces with democfg file and it is working well i got the prompt 

    but with other mmwave prompt doesnt appear. i did exact same process and the flashing is done without warning and error 

    reynald 

  • Former Member
    0 Former Member in reply to reynald pireyre

    Hello Reynald,

    Using an AOP EVM I did the following and did not experience any issues. Can you try the same and let me know if you see issues?

    1. Flash the pre-compiled bin from: C:\ti\mmwave_industrial_toolbox_4_0_1\labs\out_of_box_demo\68xx_aop_mmwave_sdk_hwa\prebuilt_binaries

    2. Close UniFlash. Press NRST or remove and replug USB (either way worked for me).

    3. Open mmw_area_scanner.exe

    4. Select 68xx. Enter COM Ports (Enhanced = UART Standard = DATA).

    5. Select cfg file from: C:\ti\mmwave_industrial_toolbox_4_0_1\labs\area_scanner\68xx_area_scanner_v1\chirp_configs

    Launch GUI following directions in lab User's Guide.

    Amanda

  • Hi Amanda, 

    I did the same as you several time from 1 week ago ... and always same behaviour. 

    I reach the point where the sensor start but i get no point on the 3D viewer ... no object are detected ...  

    i really don't understand where is the misstake. 

    is there any thing to do after through the gui to get the plot on the 3D?

  • Hi,

    I have the same issue with my IWR6843AOP EVM. Actually, I couldn't run 

    mmWaveDemoVisualizer-AOP till the pre-complied updated binary file available in 

    mmWave Industrial Toolbox 4.0.1 to fix the issue which likely doesn't occur in every  

    IWR6843AOP EVM.  Hopefully, this issue will be identified and fixed soon.  

    James

  • Hi Amanda, 

    Do you have any update it seems other people are facing issue with the EVM. 

    Could  you please help on this. 

    thanks and regards 

    reynald 

  • Former Member
    0 Former Member in reply to reynald pireyre

    Hello Reynald,

    I am unable to replicate the behavior you have described if the EVM is working correctly for online visualizer then we know the hardware is working OK and you have correct demo bin flashed.

    You are saying that the CFG is being sent wihtout issue but after the sensorStart you are not getting any detected objects shown. Is the frame number increasing? Or is it also not updating? I think possibly the issue could be that Matlab needs more resources to visualize the data on your computer than is available. Can you try this cfg which has a longer frame period/slower update rate and see if this changes the behavior? 

    profile_5fps_10m.cfg

    Amanda

  • Hi, 

    In fact i didn't resolve the problem but find a work arround 

    I installed  virtual machine + ubuntu + ROS and run the robot lab. 

    It is working fine i can get the feedback from board EVM + mmwave board 

    Now i am working to understand result. 

    Do you have any advice about tutorial to understand and play quickly with rviz 3d visualizer? 

    thanks for all 

    reynald 

  • Former Member
    0 Former Member in reply to reynald pireyre

    Hello Reynald,

    We don't have any additional resources about RVIZ but it's an open source component of ROS and there are several resources online or books that may be useful instead.

    Best,

    Amanda

  • ok will work on this 

    BTW the problem of the lab is clearly not resolved. 

    For sure there is a problem somewhere i was able to run the demo and the robotics labs when the area scanner doesn't work after 1 week effort 

    thankas and regards 

    reynald 

  • Former Member
    0 Former Member in reply to reynald pireyre

    Hello,

    The issue with the lab appears to be on the visualizer and pc side and not the EVM. Have you tried the solution I previously provided with an alternate config? If you are wanting to pursue a resolution on this issue please see the reply and report back.

    Thanks,

    Amanda

  • dear Amanda, 

    Of course i tried your solution but the result is the same 

    i tried without the mmwave board interface only the EVM, i will try with mmwave. 

    Btw do you have tutorial explaining the differents seeting of the config file; i have the mmwave user guide but if you have some other material it should help . 

    thanks for your support 

    Reynald  

  • Former Member
    0 Former Member in reply to reynald pireyre

    Hello Reynald,

    The mmWave SDK is the definitive resource for understanding the CLI commands. However, if in general you would like to better understand the commands that relate to the processing chain I would recommend referring to the doxygen for the demo found in the docs directory of the SDK demo (ex: C:\ti\mmwave_sdk_03_03_00_02\packages\ti\demo\xwr68xx\mmw\docs\doxygen\html)

    For details on understanding chirp design this application note is a good starting point: http://www.ti.com/lit/pdf/SWRA553

    As far as continuing to debug the issue with the lab to recap since this thread has been going on for awhile:

    • The EVM is flashed with the binary from the mmWave SDK OOB lab in Industrial Toolbox 4.0.1
    • Using the 4.0.1 version binary you are able to run the lab without issue using the online visualizer and the ROS visualizer.
    • Using the 4.0.1 version binary you are NOT able to use the Matlab visualizer. You have tried the default cfg as well as the lower FPS cfg attached in the thread. The behavior is that the CFG is sent but not data is received on the PC side?

    This is quite irregular behavior I don't believe any of the previous threads are having the same issue. Again, it appears that the EVM and firmware are working as expected so the issue appears related to the PC's ability to run the Matlab visualizer:

    Can you try the following and report back:

    • Reinstall Matlab 9.2a runtime and try again.
    • Try again running the visualizer and loading the CFG. Even if Matlab visualizer crashes if the CFG was loaded correctly you should be able to open a terminal to the data port and see data coming in. This would confirm that the issue is the PC cannot handle streaming and parsing the data while updating the graphical display. You will need a different PC.
    • If data is not appearing, instead flash CCS debug binaries instead and load the pre-compiled debug bins. Run the .exe and load the cfg and paste the message(s) received on the console CCS console to see if there are debug/error messages. 

    Amanda

  • Hi Amanda, 

    I reinstalled the matlab as you propose and now the lab is working. 

    thanks for you support 

    reynald