This thread has been locked.

If you have a related question, please click the "Ask a related question" button in the top right corner. The newly created question will be automatically linked to this question.

CC2640R2F: CC2640R2F CC-DEVPACK-DEBUG Not Able to Detect

Part Number: CC2640R2F
Other Parts Discussed in Thread: CC-DEVPACK-DEBUG

Hi Ti Experts,

My xds110 debugger is unable to detect the cc2640r2f chipset, but when I change to other debugger and it can detect the chipset.

I got 2 debuggers having the same issue right now. Is this something related to the software or the debugger is defect?

I'm using IAR (version 8.11.2). I tried power cycle thing, change DUT, change USB cable and none of these things help.

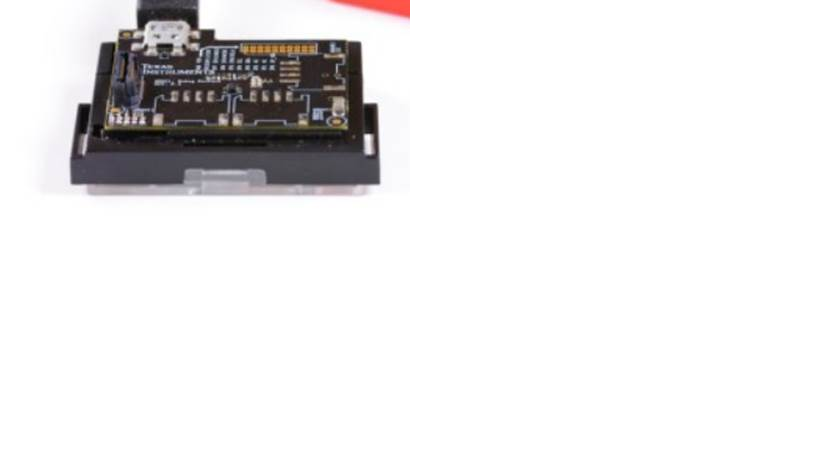
This is the debugger that i mentioned:

Please advice,

Thanks,

Teach Me

  • - Is this a CC2640R2F development board or your custom board you are trying to connect to?
    - Which debugger do you use when you manage to connect with the target?
    - How do you connect the CC-DEVPACK-DEBUG to your target? How is this connection compared to the other debugger you use?
    - You write that you use IAR, is it the same if you use flash programmer 2 or others?
  • Hi TER,

    Please refer below reply:

    - Is this a CC2640R2F development board or your custom board you are trying to connect to?
    ans: Is our own design board with CC2640r2f chipset.

    - Which debugger do you use when you manage to connect with the target?
    ans: XDS110 debugger as shown above

    - How do you connect the CC-DEVPACK-DEBUG to your target? How is this connection compared to the other debugger you use?
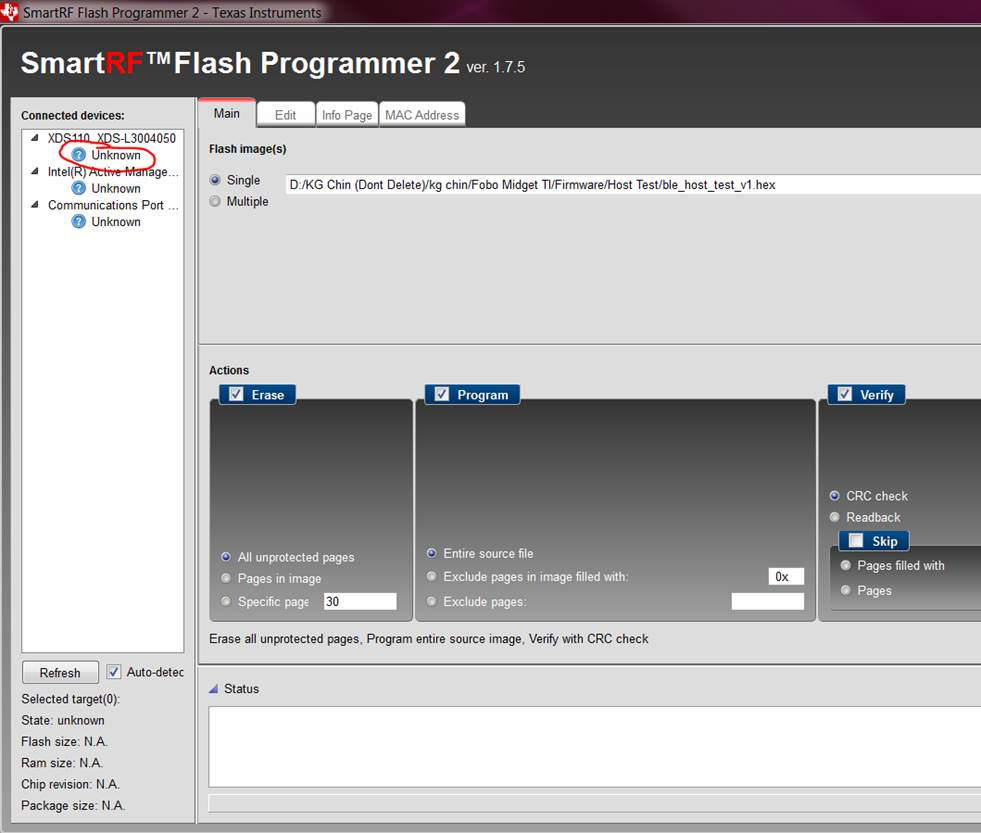
    ans: From SmartRF Studio. If ok, the debugger can trace the chipset very fast, but if not ok, then it will show me ‘unknown’

    - You write that you use IAR, is it the same if you use flash programmer 2 or others?
    ans: Yes. all are using IAR to flash.
  • If I read your reply correctly: YOu have 2 CC-DEVPACK-DEBUG that does not work and 1 CC-DEVPACK-DEBUG that does work?
  • Hi TER,

    Sorry for the confusion.

    Actually, is both debugger is  not able to detect the CC2640r2f chipset.

  • So you are not able to connect to the board with any debugger? 

    To be able to help we need a clear description of the issue and what do and do not work. 

  • Hi TER,

    The details failure conditions as below:
    > Initially the debugger is working fine, but after a few round of program, the debugger suddenly unable to detect the CC23640r2f chipset.
    > The connected device status become "unknown"
    (picture as shown in previous post)
    > After performing some plug, unplug, restart and power cycle, the condition still the same.
    > So far 2 CC-DEVPACK-DEBUG does not work while 1 CC-DEVPACK-DEBUG work fine.

    Please advice.
  • To see if I understand this correctly:
    If you have programmed a custom board a few rounds you lose connection with the chip. But if you change debugger (on the same board) you are able to connect?
  • Yes. After changing another debugger, it able to connect.
  • This does not quite make sense.

    I have seen before that you can get an unknown if the jtag interface is disabled on the chip. But I have not seen that this change if you change the debugger. It could look like the JTAG interface on the debugger has been destroyed for some reason. If you try to monitor the jtag traffic for a working and non working debugger when trying to connect, what is the difference?
  • Have you manage to have any progress on this?
  • Hi TER,

    The debugger now has worked properly.
    This issue seem to happen intermittent.

    We will try out for some time first.
    If the problem resume/persist, will get back to TI for further solution.

    Thanks for the assistant!