This thread has been locked.

If you have a related question, please click the "Ask a related question" button in the top right corner. The newly created question will be automatically linked to this question.

RTOS/CC2640R2F: Understanding and using heap manager metrics

Part Number: CC2640R2F

Tool/software: TI-RTOS

Hy,

after verifying that there is no stack issue I try to analyse the heap. I define HEAPMGR_METRICS as predefined symbol in the app project and find the global variables

heapmgrBlkCnt
heapmgrBlkFree
heapmgrBlkMax
heapmgrMemAlo
heapmgrMemFail
heapmgrMemFreeTotal
heapmgrMemMax
heapmgrMemUB

as expected. There is no display in ROV and ROV2 view:

But I can still see the variables as expressions:

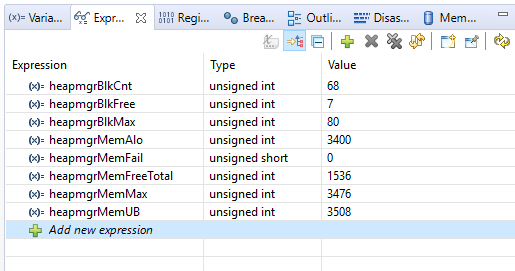
There I see that memUB is higher than MemAlo. Do I have a problem? There is no MemFail...

In map file I see

20003c68  heapEnd                                                                   
20002920  heapStart                                                                 

So there is 4936 bytes for heap? So my UB of 3508 is still far from being critical?

I also tried to activate HeapTrack by adding

BIOS.heapTrackEnabled = true;

into app_ble.cfg, but I do not see any effect on the project.

Any hints?

Regards

Harald

4936
  • Hi Harald,

    memUB is "Upper Bound", and this can be higher than the actual maximally allocated amount due fragmentation. But yes, it is still some ways from being critical. You would have seen memFail > 0 if an allocation failed.

    To use heapTrack you need to change the memory configuration in the app_ble.cfg file, please see this thread answer:

    e2e.ti.com/.../2872579

    Best regards,
    Aslak