This thread has been locked.

If you have a related question, please click the "Ask a related question" button in the top right corner. The newly created question will be automatically linked to this question.

CC2640R2F: CC2640R2F hard fault

Part Number: CC2640R2F
Other Parts Discussed in Thread: SYSBIOS,

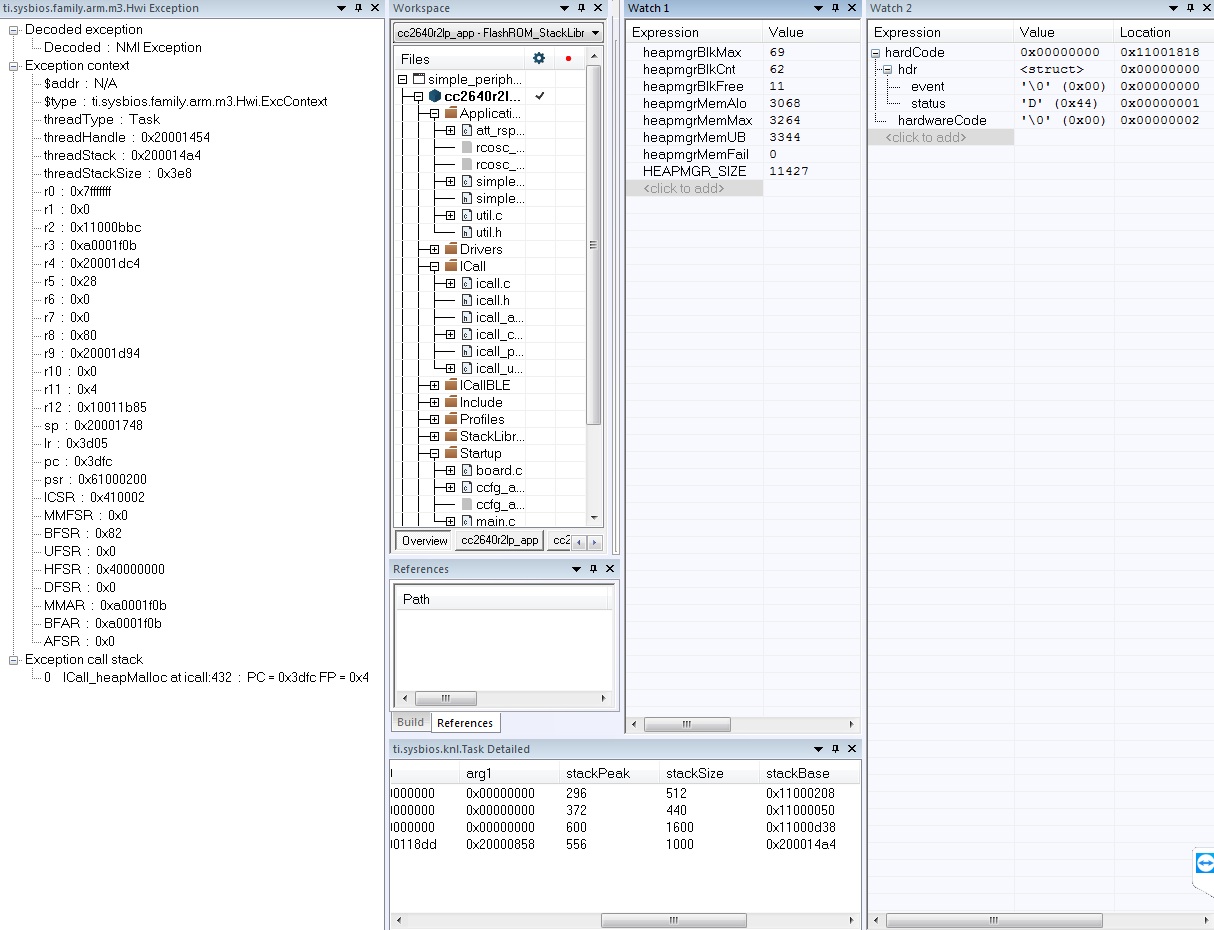
Hello! I use custor simple_peripheral project on custom board. All works good, but after long time (40min, hour, 1.5 hours) i get an exeption.

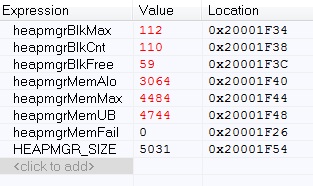
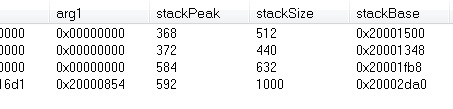
Tasks stacks, heap are looks good. What could be the problem?

[ti_sysbios_family_arm_m3_Hwi_excHandler__I + 0xd]            

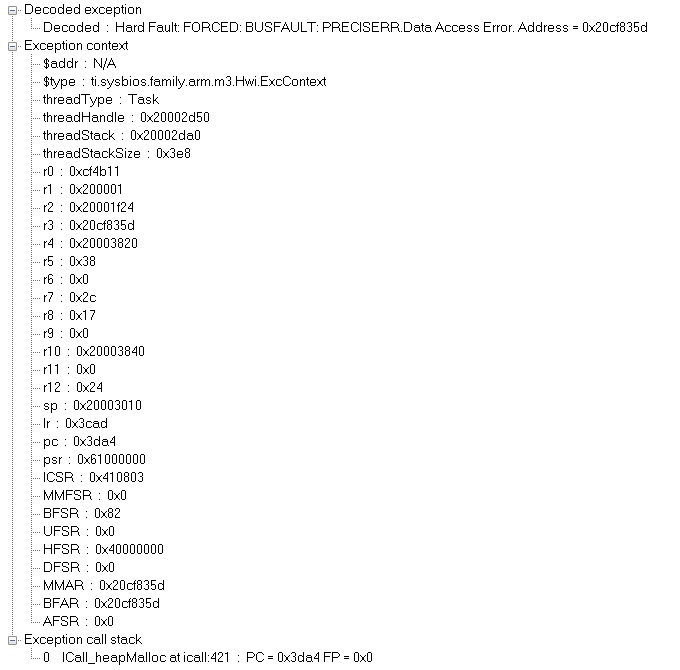
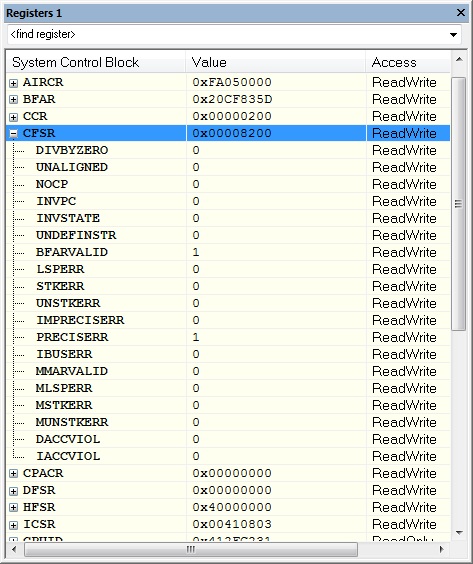
 The processor has escalated a configurable-priority exception to HardFault.    

   A precise data access error has occurred (CFSR.PRECISERR, BFAR) at data address 0x81ac6e48.           

Exception occured at PC = 0x3da4, LR = 0x3cad

See the call stack for more information.             

PC = 0x3da4 it is:

void *HEAPMGR_MALLOC(hmU32_t size)

{

tmp = *hdr;
0x3da4: 0x6818 LDR R0, [R3]

LR = 0x3cad it is:


ICall_CSState ICall_enterCSImpl(void)
{
0x3ca8: 0xf7ff 0xffb6 BL ?Veneer 1 (6) for ti_sysbios_family_arm_m3_Hwi_disableFxn__E ; 0x3c18
0x3cac: 0xf8ad 0x0002 STRH.W R0, [SP, #0x2]
return cu.state;
0x3cb0: 0x9800 LDR R0, [SP]
0x3cb2: 0xbd02 POP {R1, PC}

  • Hello, Joakim!

    Yes. Using this section, I got the information that I attached in the first post. What else can I see to solve the problem?

  • Hello Alex,

    It`s hard to to say.

    The data access error address from your exception information screen shot is 0x20CF835D. The RAM address start at 0x20000000 and CF835D is far over the valid range (13,599,581) as there is only 20 kB of RAM on CC2640R2F. I wild guess might be that somewhere in your code a far to big heap block is requested and HEAPMGR_MALLOC tries to allocate regardless.

    Are you able to add code to HEAPMGR_MALLOC to check for and catch calls with large size values? If so then maybe you can get a more detailed call stack if you add a breakpoint there.

    Have you added code in your application that use the heap which might be the culprit?

    Which SDK version is this?

  • Hello, Eirik! Thanks for answer!

    //Are you able to add code to HEAPMGR_MALLOC to check for and catch calls with large size values?

    //If so then maybe you can get a more detailed call stack if you add a breakpoint there.

    Thanks, I will try to do it!

    //Have you added code in your application that use the heap which might be the culprit?

    my code don't use heap. I think that problem in stack because LR = 0x3cad points to ICall_CSState ICall_enterCSImpl(void) and hard fault occurs when devices are connecting.

  • Hello Eirik!

    Sorry, i forgot to reply:

    //Which SDK version is this?

    I use simplelink_cc2640r2_sdk_2_30_00_28

  • Eirik,

    //I wild guess might be that somewhere in your code a far to big heap block is requested and HEAPMGR_MALLOC tries to allocate regardless.


    when a hard fault occurs, the parameter size of void * HEAPMGR_MALLOC (size hmU32_t) looks quite normal (no more than 1000, as I noticed).

    I think that problem in this code:

    hdr = (heapmgrHdr_t *)((hmU8_t *)hdr + tmp);

    tmp = *hdr;

    Usually tmp is something like 0x800003ec and 0x000025E4. And with hard falt it takes different values. For wxample 0xa0001f83


    Why can this happen?

  • Eirik, hello!

    I made mistake in previouse post: 

    Usually Address is something like 0x800003ec and 0x000025E4

    So no i see that often Address  equal to 0xa0001f83.

    What else can I check?
  • Eirik, I added code that catches if ((uint32_t) hdr == 0xa0001f83) {

    And before hard fault, i get call stack:

    ICall_heapMalloc(hmU32_t size = 40)

    osal_msg_allocate(uint16 len = 22)

    [sendEstLinkEvent + 0x17]

    So size is good, and len of osal_msg_allocate is good.

    What could be the problem?


  • Hello Alex,

    Sorry for the delayed response. I believe the heap is corrupted before the hard fault occur.

    The way malloc works when allocating a new block is to scan the heap from heap start and read the length field of each block to determine the size of the current block, then skip length number of bytes and read the next block length until a free block is found. Most likely you heap is already corrupted from a earlier write where perhaps a block write overwrite the next block length header which can cause malloc to read an invalid length field and skip out of bounds.

    Here are a few suggestions:

    1. Just to make sure, try to increase your application stack size. even though stack peak is below at 584/632 there can be cases where the stack peak is higher than what is reported.

    2. At hard fault, extract the heap memory or entire ram memory + MAP file and attach it here so I can help to take a look at it.

    3. You can also try to change to Heaptrack+heapmem and use ROV to inspect the heap to locate corrupted blocks. You might have to increase some of the task stack sizes when using this.

    4. Last approach is to convert to latest SDK and verify if the problem still exist as there has been quite a few updates since simplelink_cc2640r2_sdk_2_30_00_28.

  • Hello, Eirik! Thanks for answer!

    //1. Just to make sure, try to increase your application stack size. even though stack peak is below at 584/632 there can be cases where the stack peak is higher than what is reported.

    I increased stack size from 640 to 1600. Now i use CACHE_AS_RAM=1 but the problem with hard fault still stay. 

    //2. At hard fault, extract the heap memory or entire ram memory + MAP file and attach it here so I can help to take a look at it.

    How can i extract heap mem? Is is possibility in IAR to save mem to file?

    //3. You can also try to change to Heaptrack+heapmem and use ROV to inspect the heap to locate corrupted blocks. You might have to increase some of the task stack sizes when using this.

    I attached ROV windows with inspection of hard fault (with hardCode details). Is it that you asked?

    //4. Last approach is to convert to latest SDK and verify if the problem still exist as there has been quite a few updates since simplelink_cc2640r2_sdk_2_30_00_28.

    ok! I'll try...

  • Hello,

    2)

    You can open memory browser and extract the heap which is given by the address range in variables heapStart and heapEnd. Export that area as hex.

    http://dev.ti.com/tirex/explore/content/simplelink_cc2640r2_sdk_3_20_00_21/docs/blestack/ble_user_guide/html/ble-stack-3.x-guide/debugging-index.html?highlight=heapmem#determining-the-auto-heap-size 

    3)

    You can refer to the users guide on how to change the heap configuration to heapmem+heapstack. Then you will get a separate HeapMem module module in ROV.

    http://dev.ti.com/tirex/explore/content/simplelink_cc2640r2_sdk_3_20_00_21/docs/blestack/ble_user_guide/html/ble-stack-common/memory_management.html?highlight=heapmem#configuring-the-heap 

  • I'm going to close this post for now then. If you have feedback within a few days you can follow up question to reopen this thread.
    If it takes longer than please post a new thread by pressing the orange button + Ask a related questions.