


Other Parts Discussed in Thread: ENERGYTRACE
Hi everyone,
I have been trying EnergyTrace on the CC1352R1 launchpads, initially I've followed this guide: https://software-dl.ti.com/simplelink/esd/simplelink_cc13x2_26x2_sdk/5.20.00.52/exports/docs/ti154stack/html/energy-trace/energy-trace.html
Using EnergyTrace on standalone mode works well, ALTHOUGH I had to use the instructions of jumper configuration shown on figure 34 of page 28 of this guide: https://www.ti.com/lit/an/swra478d/swra478d.pdf as well as a board power cycle after any jumper modification for current recalibration. Both jumper configuration and board power cycle are NOT MENTIONED on the first guide, which led me to a lot of completely different measurements and battery estimations using exactly the same code and settings, which I had absolutely no idea why, until I read the second guide.. So I think this info should be added on the first guide.
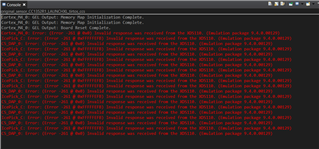
Now, using the EnergyTrace++ is when most problems appear, it is almost unusable. After starting the debug session, most of the times the debugging just fails, or works for a few seconds and then fails. Sometimes it works but with periods without EnnergyTrace data. I keep getting the -261 error code, either IcePick_C or CS_DAP_0, bellow is a printscreen of the console during the EnergyTrace++ debug session. I have searched around on E2E forums, but it seems to be kind of an unknow communication issue, I've tried changing USB ports, USB cables, not using any HUBs, it still always happen. Only thing I haven't tried is using a different PC. I'm on a windows 10 machine, with CCS V10.4.0.00006. I'm running the TI15.4 stack sensor/collector default demo without any changes except the disabled broadcasts (dwell time 0).
Sometimes I am able to get a complete 1 minute session, although it still has moments where the -261 error occurred and for that reason, no data seems to be available for those moments, but fortunately the system recovered from the errors and was able to continue the session. Most of the times this is not the case, as the debug sessions just stops, or the EnergyTrace windows just crashes and disappears from the debug environment.
Bellow is an image with both the EnergyTrace++ states and current measurements together from the same test, on a sensor device with the default TI15.4 stack demo (with no broadcasts/dwell time 0).

But even in these rare occasions where I get a complete session, I wonder about the reliability of these results. For instance, on the states graph, after the rejoining process happens (around the 26/27s mark) there seems to be a lot of activity (as expected since the default demo has 3s report interval, 2s poll interval and 5s tracking intervals), however, most of these activities are showing only RX activities and almost no TX, except near the end of the graph.
So my questions are:
1 - Why aren't all the supposed TX activities showing on the states graph?
2 - How reliable is the EnergyTrace++?
3 - What can I do to stop or minimize the -261 errors during the EnergyTrace++ debug session? Because it is almost impossible to use like this.
Thanks for your time,
Joao


