This thread has been locked.

If you have a related question, please click the "Ask a related question" button in the top right corner. The newly created question will be automatically linked to this question.

LAUNCHXL-CC1352R1: Energy Trace for DMM

Part Number: LAUNCHXL-CC1352R1
Other Parts Discussed in Thread: SYSCONFIG, ENERGYTRACE

Hello,

I was interested in the current consumption of the dmm_154sensor_remote_display_oad_app_CC1352R1_LAUNCHXL_tirtos_ccs. I used Energy Trace for the same.

(referred to this link for setting up the energy trace - http://dev.ti.com/tirex/content/simplelink_cc13x2_sdk_2_30_00_45/docs/ti154stack/html/energy-trace/energy-trace.html)

Setup details -

Used the dmm_sensor_oad straight from the Resource Explorer. So the Reporting interval, Polling Interval, etc, were unchanged.

The only change made was to change the mode to Frequency Hopping.

Also, declared these two MACROS - (POWER_MEAS, POWER_TEST_PROFILE)

I am attaching a screenshot for the observed Energy Trace result - 

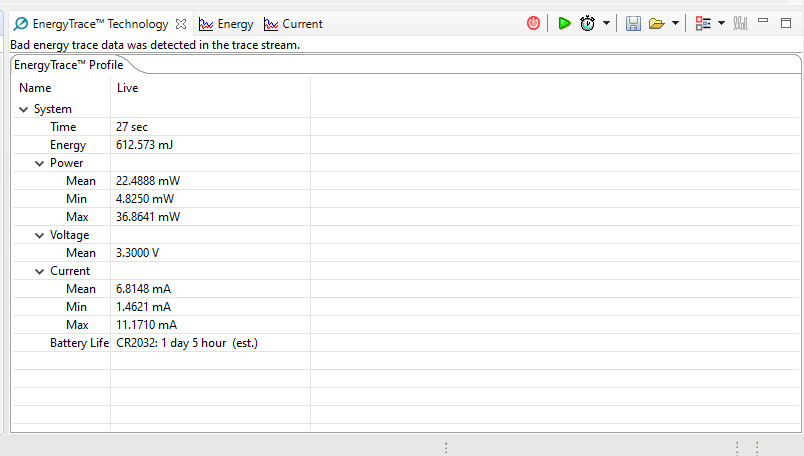
There are 2 questions regarding this -

1) The observed current seems to be quite high, is it expected?

Am I missing out on some steps which result in the high current?

2) I took the observation for 1 minute but I got an error after just 26 seconds and the Trace stopped (error can be seen in the screenshot). "Bad energy trace data was detected in the trace stream".

Can you help me in knowing why this error occurred? 

Thanks and Regards,

Yash.

  • Hey Yash,

    Can you verify that the UART and other peripherals have been turned off? Usually with a current that high, the suspect is that UART was not shut down.

    Yash 101 said:
    I took the observation for 1 minute but I got an error after just 26 seconds and the Trace stopped (error can be seen in the screenshot). "Bad energy trace data was detected in the trace stream".

    I too experience this issue. Unfortunately my only recommendation is to recapture the trace, and sometimes restart the tool.

  • Hi Ammar,

    Thank you for your prompt response.

    Ammar N said:

    Can you verify that the UART and other peripherals have been turned off? Usually with a current that high, the suspect is that UART was not shut down.

    As mentioned earlier, I declared these macro's -  POWER_MEAS and POWER_TEST_PROFILE, I thought they would do the trick( won't they?).

    Anyways, I explicitly removed UART from the .opt file, I.e

    -DxBOARD_DISPLAY_USE_UART
    -DxBOARD_DISPLAY_USE_LCD

    I still observe the same current reading as shared in the screenshot.

    Do I have to do anything else to suppress the UART? 

    What current reading do you observe on your side, Can you please share a screenshot of the same?

    Thanks and Regards,

    Yash.

  • I will look into this and get back to you.

  • Hey Yash,

    Using the latest SDK, I defined POWER_MEAS as well as enabled the Power Test Profile mode using the SysConfig tool (set to Data and ACK), and saw the following measurements.

    Did you make any application changes to your project?

  • Hi Ammar,

    Answering your question - "Did you make any application changes to your project?" -

    As I mentioned earlier - 

    "I used the dmm_sensor_oad straight from the Resource Explorer. So the Reporting interval, Polling Interval, etc, were unchanged.

    I made one change - Changed the mode to Frequency Hopping."


    I am trying to find out what I am doing differently, and hence I need to confirm a few things -

    1. In the screenshot you posted, was FH enabled?

    And also, was this trace taken while 15.4 communication in DMM_Sensor_oad and DMM_Collector_oad was going on? Or was it just the DMM_sensor_oad in its initial state?

    2. I can see in your screenshot that after Energy Trace Profile in brackets it says - "Relative Measurement", whereas mine doesn't say so. Is there any particular reason for that?


    Thanks and Regards,

    Yash.

  • Thanks Yash for clarifying. 

    Yash 101 said:

    1. In the screenshot you posted, was FH enabled?

    And also, was this trace taken while 15.4 communication in DMM_Sensor_oad and DMM_Collector_oad was going on? Or was it just the DMM_sensor_oad in its initial state?

    I apologize, I overlooked the mode. Attached are my numbers when the device has not connected and is in its initial state.

    Yash 101 said:
    2. I can see in your screenshot that after Energy Trace Profile in brackets it says - "Relative Measurement", whereas mine doesn't say so. Is there any particular reason for that?

    Which version of CCS are you using? This may be the reason for the discrepancy, as I tested using CCSv9.2. In any case, I would not be concerned!

  • Hey Yash,

    I've looked into this some more, and have some new points to keep in mind:

    • Ensure the device goes to sleep on Energy Trace (you should see close to 1uA of current)
      • If this is not the case, try resetting the board and restarting energy trace. If this doesn't work, there may still be some code modifications required.
    • The DUT should be the only device plugged into your PC when using Energy Trace (the tool measures the first device found in the PC's list of serial devices)
    • Go to Windows>Preferences>Code Composer Studio>Advanced Tools>Energy Trace and set Target Connection to XDS110
    • Run Energy Trace with the debugger off as this adds some current to the measurement

    I'll record a new measurement with the above in mind and verify the results.

  • Hi Ammar,

    Answering your question -  "Which version of CCS are you using? "

    I am using CCSv9.3.0.

    I observed that, if Energy Trace is set to "Auto launch on target connect" ( by going to this path Windows>Preferences>Code Composer Studio>Advanced Tools>), and code is debugged, the Energy trace window shows Relative measurement. 

    Ammar N said:
    • Ensure the device goes to sleep on Energy Trace (you should see close to 1uA of current)

    Can you please tell me, how can I ensure that the device is in sleep mode (any code/sysconfig changes)?

    Regarding other points, I ensured all of them are followed and still observed the same results.

    Thanks and Regards,

    Yash

  • Hey Yash,

    Sorry for the delay. The only changes you should require is to go into sysconfig and select the appropriate test under Test Mode. You should see the device sleep in Energy Trace in the Current tab when you look at the current profile.

  • Hello Ammar,

    Is it possible for you to share your project so that I can cross-check if I am doing something wrong?

    Thanks and Regards,

    Yash.

  • Hey Yash,

    I've made no changes to the project other than in project settings in sysConfig as described above, as well as disabling the defines you mention as well as enabling -DDisplay_DISABLE_ALL.

    Ensure only one board is plugged into your PC and start EnergyTrace. A starting point is to make sure the device goes to sleep. When that happens, the current should stabilize at ~1uA.