This thread has been locked.

If you have a related question, please click the "Ask a related question" button in the top right corner. The newly created question will be automatically linked to this question.

CCS/LAUNCHXL-CC1352P: Cannot restore out of box experiance nor debug from CCS

Part Number: LAUNCHXL-CC1352P
Other Parts Discussed in Thread: UNIFLASH, MSP-EXP430FR2311

Tool/software: Code Composer Studio

I have two identical LAUNCHXL-CC1352P1. I tested "Out of box experiance" via App and that worked well. Then i tried to build & flash the "Project-zero" in SDK from CCS (newly istalled, latest version, on fresh WIN10 PC). Build se ems fine but when i start debugger it looses contact with board (last messages on console are " Cortex_M4_0: GEL Output: Memory Map Initialization Complete. / Cortex_M4_0: GEL Output: Board Reset Complete."

Unable to pause debugger as pause-button is greyed out. No output on any of the two serial-ports (XDS110 Class Application/User UART (COM3)” and “XDS110 Class Auxiliary Data Port (COM4).). Both TI Debug Probes (and com ports) are visible in Device Manager. Only option is to stop debugger.

After this i have tried to reinstall "Out of box experiance" without sucess. When starting to flash, the progressbar reaches about to 20%, then stops without any message. After this, when the mouse hovers over the icon there is a context-message saying “Disconnect serialIO to flash device”. Unsure what that means. Same happens when i try from another computer (and i have tried with both boards).

Have also tried to flash "BIM-file" with Uniflash. Seems to work (Uniflash detects correct board and programs & verifies programming). Still i am left with two boards that i neither am able to debug nor restore inital out-of-box experiance.

(I am new to this device family so maybe i miss something very basic. I am able to program and debug an MSP-EXP430FR2311 board without any problems from same PC/CCS).

  • Hello Sven,

    Sven Marti said:
    Build se ems fine but when i start debugger it looses contact with board (last messages on console are " Cortex_M4_0: GEL Output: Memory Map Initialization Complete. / Cortex_M4_0: GEL Output: Board Reset Complete."

    I am not sure what is meant by "the debugger losing contact with the board". Does the debugger lose JTAG connectivity with the board? 

    Sven Marti said:
    Unable to pause debugger as pause-button is greyed out. No output on any of the two serial-ports (XDS110 Class Application/User UART (COM3)” and “XDS110 Class Auxiliary Data Port (COM4).). Both TI Debug Probes (and com ports) are visible in Device Manager. Only option is to stop debugger.

    Can you provide a screenshot of the issues you are describing above? 

    Please also provide the exact CCS version being used and the version of the SK being used.

    Thanks

    ki

  • Hi. CCS version is 10.0.0.00010. SDK is 4.10.

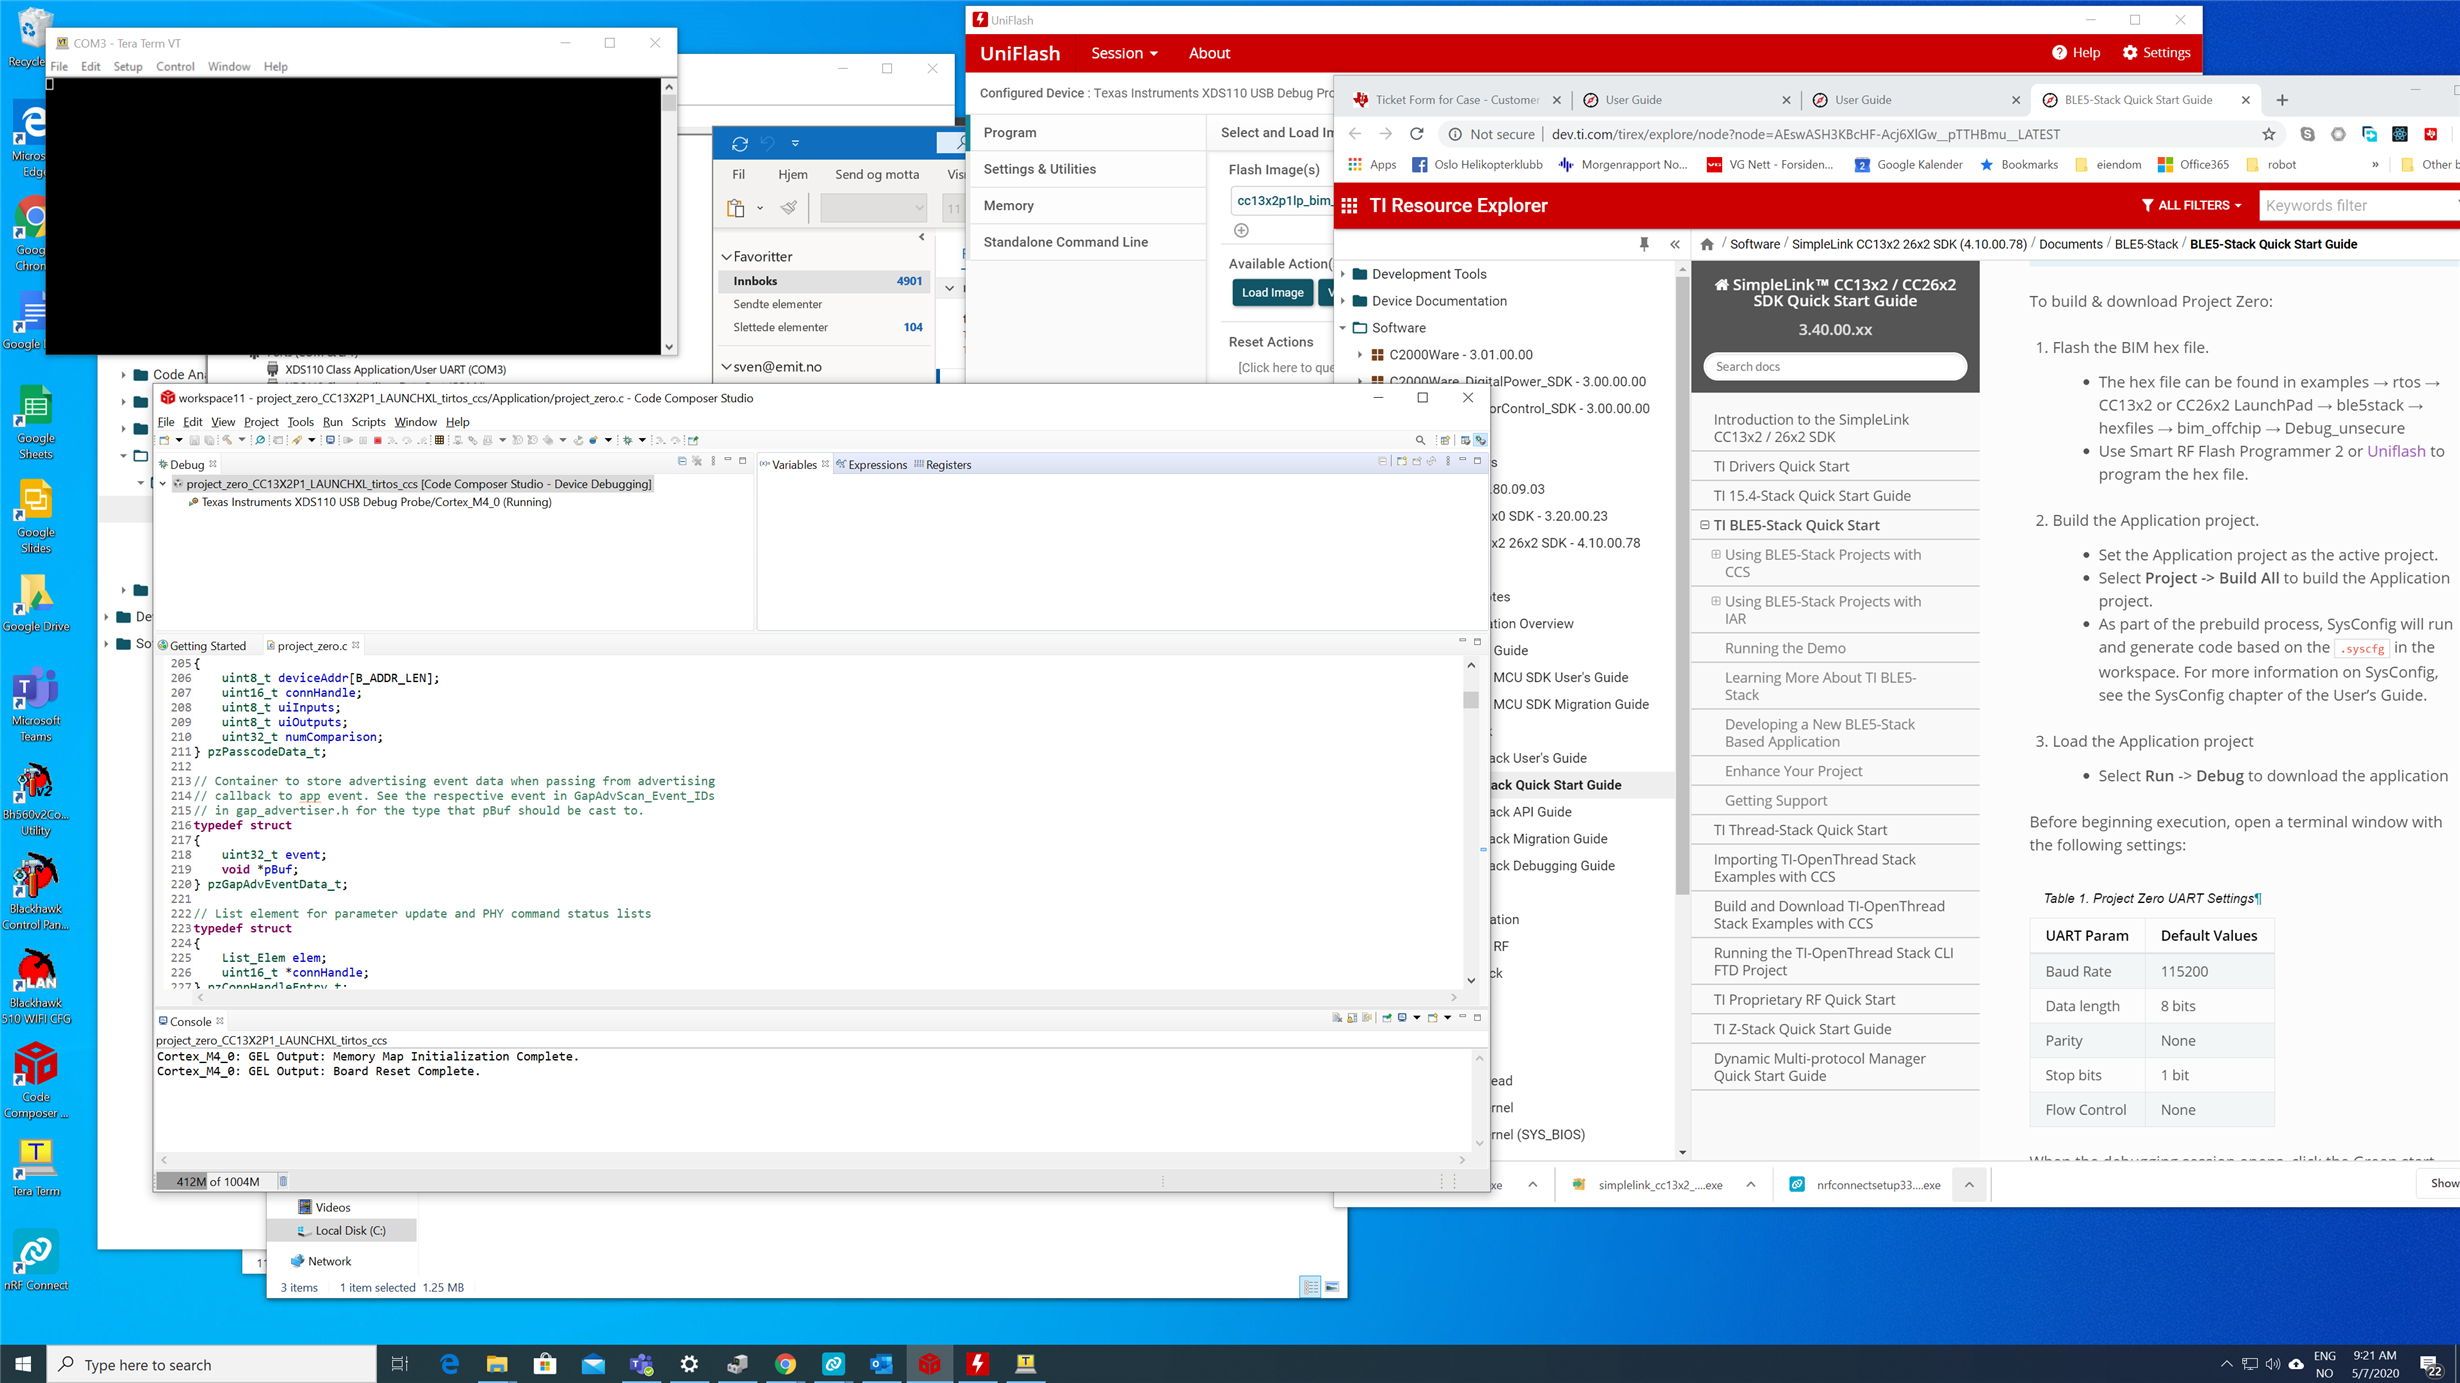
    Loosing contact i mean "no response". No more change/output in any CCS-windows. Cannot inspect memory, cannot see registers (register-tab is all blank). Only "feature" avalilable is red abort-debug icon (see picture below).

  • Sven Marti said:
    Loosing contact i mean "no response". No more change/output in any CCS-windows. Cannot inspect memory, cannot see registers (register-tab is all blank). Only "feature" avalilable is red abort-debug icon (see picture below).

    That is because in incorrect Debug context is selected in the Debug view. Instead, select the node below ("Texas Instruments XDS110 Debug Probe/Cortex_M4_0") as shown in the screenshot below:

    Use the suspend button to halt the target (or use 'Run -> Suspend' from the menu). See where the target is halted. If the program does not auto-halt at main after program load, but instead is just running, there may be some configuration issue preventing it from reaching main (a common issue is that revision of your launchpad does not support the newer SDK.

    Thanks

    ki

  • That resolved one of my problems. What remains is how can i restore original "Out of box" firmware?

  • Regarding your question on the OOBE firmware, I will move this thread to the device forum where device experts can guide your further.

    Thanks

    ki

  • I was quick regarding first question. Selecting debug context made registers visible but it does not halt on "main". But now i can pause debug and i see PC / callstack is "NOROM_SetupTrimDevice() at chipinfo.c:208.

    Does this mean that i have to switch to older SDK to make use of these kits? 

    They are marked HW Rev: A & FW:SDK 2.10

    So i guess i should try downgrading SDK - you think that would help? If so - that is maybe also the problem with "OOB"-restore?

  • Awaiting any response i have downloaded Simplelink 2.1 SDK. But CCS 10 won't import project zero:

    "Import failed for project 'project_zero' because its meta-data cannot be interpreted. Please contact support."

    Maybe i need to downgrade to earlier verson of CCS  (which one?) as well or somehow assemble sourcefiles into CCS10 project "by hand"?

  • Please see the following regarding the different revisions.

    For all the different SDKs, the release note will tell you which CCS version is used for testing.

    BR

    Siri