


We have designed a product with the CC3220SFMODA that awakes from hibernation, makes a connection to the AP, then sends a request to our Server. The Server responds with a payload of about 1KB or so, then the device returns to hibernation. We are able to complete this transaction over Port 80, 8443, and 443 as part of our testing, although we prefer use of Port 443.
We notice that when Port 443 is used the response packets from the Server are delayed, so our code hangs in HTTPClient_readResponseBody waiting for it to return. This does not happen when Port 80 or 8443 used. We secure Port 443 and 8443 with the same certificate.
Wireshark Trace Port 8443 (“normal” case):
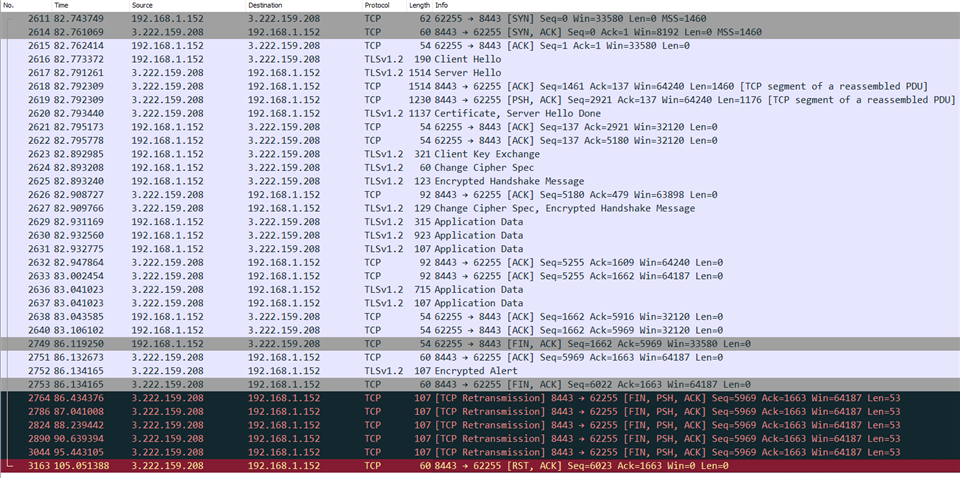
Reference 2636/2637, the responses from the Server on .208 are back to back. Our unit hibernates again at the end which I think is responsible for the TCP Retransmissions. Ultimately the entire process is completed in about 3 seconds, and while I see the real delay with the FIN, ACK from the CC3220, this has not been an area of focus.
Wireshark Trace Port 443 (problem case):
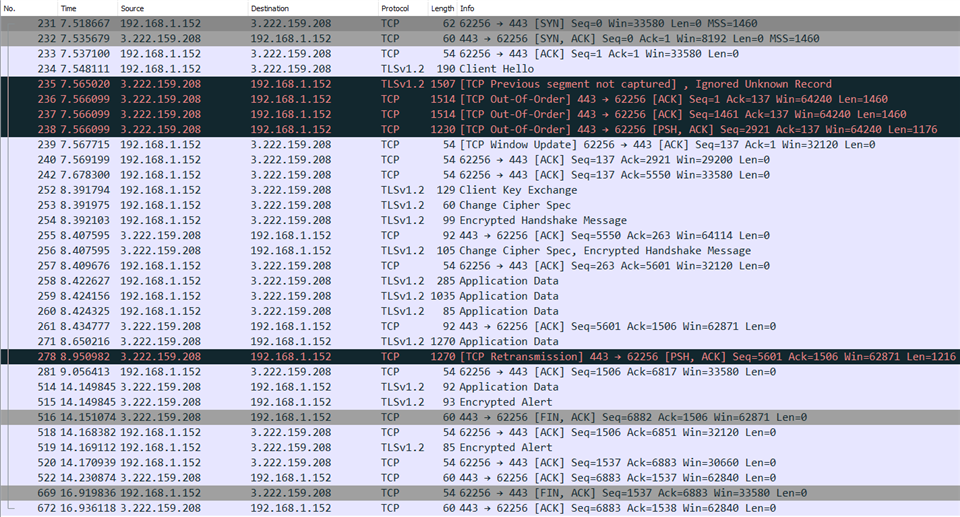
The problem here is the time between line 271 and 514 for the delivery of two transfers from the Server on .208. We can see from the serial debug that the expected server response is returned by HTTPClient_readResponseBody from line 271 and the code just sits waiting for the function to return after calling again because moreDataFlag is not clear. When this returns there is no additional data from the function so we do not understand what we are waiting for. This is really a symptom of how the data comes back from the Server, and we are trying to figure out why operation on Port 443 would cause it to operate differently. We have other software products that when connected to the same Server over Port 443 do not have this anomaly.
Application Code:
We followed the example code recommendation to continue calling HTTPClient_readResponseBody until moreDataFlag is clear. The first call returns the message content we are expecting, the second call processes the remainder that is sent from the Server.
Code portion w/debug statements:
len = 0;
int rOnce = 0;
do
{
Display_printf(display, 0, 0, "do loop start, Reading readResponse \r\n");
ret = HTTPClient_readResponseBody(httpClientHandle, data, sizeof(data),
&moreDataFlag);
Display_printf(display, 0, 0, "Read Response Done \r\n");
if(ret > 0){
//Loop has read at least once
rOnce = 1;
Display_printf(display, 0, 0, "rOnce \r\n");
}
//True if read response returned data at least once in this loop AND current loop is 0
if(rOnce && ret == 0){
//First 2 elements of data array are overwritten with garbage data for some reason
//Manually fix the issue here
data[0] = '{';
data[1] = 0x22; // double quote in ascii
Display_printf(display, 0, 0, "Manual Fix \r\n");
}
if(ret < 0)
{
printError("httpTask: response body processing failed", ret);
}
Display_printf(display, 0, 0, "DISPLAY PRINT: %.*s END LINE \r\n",ret,data);
len += ret;
Display_printf(display, 0, 0, "DISPLAY PRINT DONE LEN = %d \r\n",len);
Display_printf(display, 0, 0, "moreDataFlag = %d \r\n",moreDataFlag);
}
while(moreDataFlag);
Serial output during runtime on Port 8443:
do loop start, Reading readResponse
Read Response Done
rOnce
Manual Fix
DISPLAY PRINT: {"message":"Success","enabled":true,"heartbeatSchedule":{"sunday":["10","20","13","16"],"monday":["10","20","19","6"],"tuesday":["10","20","13","16"],"wednesday":["0","8","19","16"],"thursday":["10","13","19","6"],"friday":["10","0","19","16"],"saturday":["10","8","19","6"]},"returnCode":"200","serverTime":"2022-11-15T10:48:31.638-0500"} END LINE
DISPLAY PRINT DONE LEN = 339
moreDataFlag = 1
do loop start, Reading readResponse
Read Response Done
Manual Fix
DISPLAY PRINT: END LINE
DISPLAY PRINT DONE LEN = 339
moreDataFlag = 0
Serial output during runtime on Port 443:
do loop start, Reading readResponse
Read Response Done
rOnce
Manual Fix
DISPLAY PRINT: {"message":"Success","enabled":true,"heartbeatSchedule":{"sunday":["10","20","13","16"],"monday":["10","20","19","6"],"tuesday":["10","20","13","16"],"wednesday":["0","8","19","16"],"thursday":["10","13","19","6"],"friday":["10","0","19","16"],"saturday":["10","8","19","6"]},"returnCode":"200","serverTime":"2022-11-15T11:31:04.718-0500"} END LINE
DISPLAY PRINT DONE LEN = 339
moreDataFlag = 1
do loop start, Reading readResponse
Read Response Done
Manual Fix
DISPLAY PRINT: END LINE
DISPLAY PRINT DONE LEN = 339
moreDataFlag = 0
Tool Versions:
Simplelink Version: 4.40.0.07
Compiler Version: TI v20.2.7.LTS
XDCtools Version: 3.62.1.14_core
Any thoughts on what we can do to address this situation are appreciated.

