This thread has been locked.

If you have a related question, please click the "Ask a related question" button in the top right corner. The newly created question will be automatically linked to this question.

CC3220SF: Trouble connecting via 4-wire jtag debugger

Part Number: CC3220SF
Other Parts Discussed in Thread: SEGGER, UNIFLASH

Hello,

I'm bringing up a new custom board and so far have not been able to connect via the debugger (4-wire jtag). We've tried in 2 situations: 1) connecting via debugger with default FW loaded (I'm not sure what is loaded on a blank module)  2) connecting via debugger with our custom FW that we loaded via SPI flash (which also does not appear to run correctly, but we can't yet rule out a code issue, hence the need for the debugger).  We get the following error:

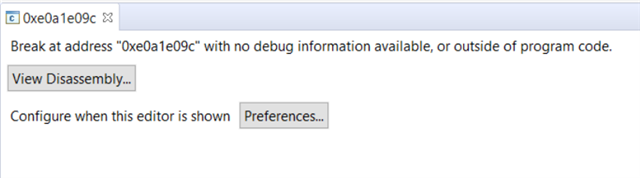
Cortex_M4_0: Error: Stat [ JLINKARM_IsHalted() call ] failed!
Cortex_M4_0: Unable to determine target status after 20 attempts
SEGGER J-Link Emulator_0/Cortex_M4_0 : Target must be connected before loading program.

Other notes:

  • We believe the pins are wired correctly, and we do see output from the j-link, but nothing on TDO.
  • We do have power to the module, and it is drawing current.
  • The SOPs are not connected--we are expecting they are all low because of the internal pull-downs. 

A couple questions

  • I created the binary as development mode, but I did not flash via Uniflash--I flashed via Cheetah adapter to SPI flash. I do want to confirm that the development mode setting will also apply for the SPI flashing method. 
  • Any other thoughts of what could be wrong?

Thanks,

Katie

  • Hi, 

    Have you gone through the hardware review process (https://www.ti.com/tool/SIMPLELINK-WIFI-DESIGN-REVIEWS)?

    In order to create a development mode image, the image needs to contain the mac address of the device (this is a protection mechanism that prevents getting to production with development image). So basically, development image can't be enabled with a gang (bin or hex) images.

    Br,

    Kobi  

  • Hi Kobi,

    If I'm understanding correctly, the ONLY way to flash a development build is with Uniflash via UART? And therefore if you want to debug a board, you MUST expose the UART for flashing and by extension you must NOT use the default SOP setting of 000? 

    So basically, anyone who needs to debug on production equivalent hardware (I'm guessing a LOT of people) will have to do the following:

    • ensure that the SOP pins are set to allow UARTLOAD as well as enabling jtag. (For 4-wire jtag, you'd have to use 010, but if you wanted 2 wire jtag you'd actually have to provide a way to change the SOP pins depending on your use)
    • route the SPI pins for header access for production
    • route the jtag pins for header access for debugging
    • ALSO route the UART pins (GPIOs 1&2) for header access for flashing debug builds, which effectively reduces the number of available GPIOs for other use (and we are now left without enough pins).

    Note that there is incorrect information about flashing debug builds via SPI flash in this recent post that could lead people very astray:  CC3220SF: Target board MCU Error Connecting to Target (Error -1170) Even though Successfully Programmed Development Mode via Uniflash - Wi-Fi forum - Wi-Fi - TI E2E support forums.  

    I wasn't aware of that hardware review process. Our client is very sensitive about sharing IP, so we can't submit a schematic w/o an NDA in place first. Is there a way to do that?

    Thanks,

    Katie

  • The easiest way to enter debug is through the UART and Uniflash.

    Theoretically, you can do the same with SPI: you should set the device to development and provides the mac address which will create the bin/hex image per device. Then you would need to synchronize the programming (e.g. by Cheetah) of each image to the flash of the relevant device.

    What is wrong about the referenced thread?

    I'm not sure about the NDA - and will need to check with the hardware team. I'll update when i have their response.

    Br,

    Kobi

  • Well, it's only easiest to use the UART if you have enough pins and enough space to provide access to that hardware.

    I'd gotten the impression from your first message that it is NOT possible to flash a development build with a gang/hex message, which conflicted with the other thread which indicated it IS possible to flash a development mode build via SPI. But now it sounds like you're also saying it's possible, so there's  no conflict

    I'm hoping to do the following:

    • flash production build 
    • run that build which prints out the mac address of the board (hopefully it just works since I have no way to debug)
    • create development build using that mac
    • try to connect via debugger

    Is there any way to find out the mac address from any information printed on the module package?

    I'm on vacation for the next few days, so I won't be able to try it till Monday

    Thanks,

    Katie

  • Hi Katie,

    No, you can't determine the MAC address based on the package. Your approach sounds okay if you must avoid breaking out the UART connection for programming/debug.

    Kobi will follow up again early next week.

    Best Regards,

    Ben M

  • Hi Katie,

    Regarding the NDA - we are not doing do that. You can let the customer know we keep the content confidential but this is a service we provide. We won’t get something signed for a hw review.

    Br,

    Kobi

  • Ok, I was able to get the mac address via production build, then create and flash a development build. However, I am still not able to connect via jtag. The progress dialog blips on the screen so fast you can't even see progress, but it should definitely take a few seconds to load. Then it sort of looks like it's in the debugger but doesn't go to main. Instead, I have the following window:

    It does appear to have halted execution of the flashed code, because an LED that was blinking is now stuck ON. 

    With the same CCS settings for 4wire jtag debugging, I'm able to connect to the launchpad, so I thought I had code composer settings correct. We've also triple-checked the pins from the jlnk to the connector on the (custom) board. 

    Any ideas about what is typically wrong when you see that behavior?

    Thanks,

    Katie

  • no. i'm not sure what is wrong. The address definitely looks wrong.

    what happens if you trigger the debug operations separately, i.e first connect to the target, then load the program?

  • Interesting idea. How do I make CCS connect to the target w/o loading the program? 

    I changed the loading options to "Load symbols only", and it looks like it joined the code already executing, but at least it was in a reasonable place in code given the behavior of the running program. So that indicates there is an issue with loading the program? What could cause that kind of problem?

    Thanks,

    Katie

  • I'll need to consult this with the CCS team. I'll update as soon as I get their response.

    Br,

    Kobi

  • Hello, just checking whether there's an update from the CCS team yet? This is definitely a blocking issue for me. 

    Thanks,

    Katie

  • not yet. I'll ping them again.

  • As I mentioned before, try to connect to the target first (first option in in the "Run"), then load the program.

    Also try a simple program e.g. one that only toggles the leds - and check if it is running successfully. If this works, try to connect through the jtag.

  • Hi,

    Kobi asked me to provide some inputs.

    Any ideas about what is typically wrong when you see that behavior?

    As you described and your picture shows, there is nothing wrong from the standpoint of the CCS IDE and the JTAG debugger. It is connected and just missing debug symbols at the specific address. The address ittself, of course, is quite strange and may be a consequence of the device not being properly initialized or its code simply went rogue.

    The course of action of connecting and then loading code is a good one.

    Interesting idea. How do I make CCS connect to the target w/o loading the program? 

    For this, please check section 7.3.2 of the CCS User's Guide at:

    http://software-dl.ti.com/ccs/esd/documents/users_guide/index_debug.html

    Following on the procedure, you should remove the "Load Symbols Only" option so you can actually flash the device via CCS. This way you will be able to follow through with the code execution and verify if anything is wrong or invalid. Keep in mind that, the way the CC32xx Wi-Fi devices are designed, at every reset the Flash will be overwritten with what is present on the SPI flash, thus requiring re-flashing the device at every reset.

    Once you find out if the board is properly working, you should then proceed to generate a valid image and write it to the external Flash via UART - something that Kobi is more knowledgeable than I.

    Hope this helps,

    Rafael

  • Baby steps are happening. 

    1) I'm using firmware that runs, and I believe the basics of the board are working. It is in a state where it loops forever while blinking an LED. When I load symbols, I'm able to attach with the debugger, step over the LED on/off function and see the behavior align with the steps in code. (symbols only)  But I do need to be able to connect to the debugger for continued development and debugging. No success on that yet.

    2) We did find a hardware issue where nRESET was going to the wrong reset on the j-link side. Sadly, that didn't magically fix everything as I'd hoped.

    3) I created a brand new clean debug configuration because I had messed around with so many settings.

    4) It STARTS to load! But then it fails to write memory:

    Cortex_M4_0: Trouble Writing Memory Block at 0x1043324 on Page 0 of Length 0x290: Flash download failed! ...
    Cortex_M4_0: File Loader: Verification failed: Target failed to write 0x01043324
    Cortex_M4_0: GEL: File: C:\Work\XXX\XXX-firmware\Build_CCS\dbg\mcuflashimg.out: Load failed.

    5) Same thing happens when I do the manual load as described in 7.3.2 of the user's guide.

    I've seen that load error on a couple of my launchpads, but haven't figured out how to fix it. What can cause that error?

    Thanks,

    Katie

  • I don't know.

    I'll need to consult with the CCS guys once again.

  • Ok, it is finally working. A few hoops I have to jump through to get to the debugger (which may be specific to my board):

    • the debugger will only connect if I power cycle the board AND let the board boot. This needs to happen every time I reload code in the debugger
    • I had to add a delay near the start of main because the debugger won't connect once the code gets past main. Possibly some GPIO setting or something that conflicts with the jtag. So after letting the board boot, I reset it and connect to the debugger within that 3s window, and it will connect. 
      • It connects much faster than loading almost the same code onto the dev kit. 

    I don't know what was causing those memory block errors above, but possibly it was partially able to load, but when the code reached the offending section, it stopped. (But it was weird that it was the same memory location every time.) Anyway the errors have gone away for the moment and I can make forward progress. 

    Thanks,

    Katie