


Other Parts Discussed in Thread: Z-STACK
Hi
Several devices we are testing get stuck after a while. (ZED device with latest ZStack 3.0.2 on CC2530).
I have the HAL_ASSERT function set to the infinite loop to detect such cases.
I was able to reproduce a device getting stuck, allowing me to confirm that at least in this case HAL_ASSERT is called.
Symbols is 0, so pMacPib->ackWaitDuration is 0.
This is where it happens - the screenshot shows a memory dump of the MacPib as well as the variable in the watch window and variables preceding that location:
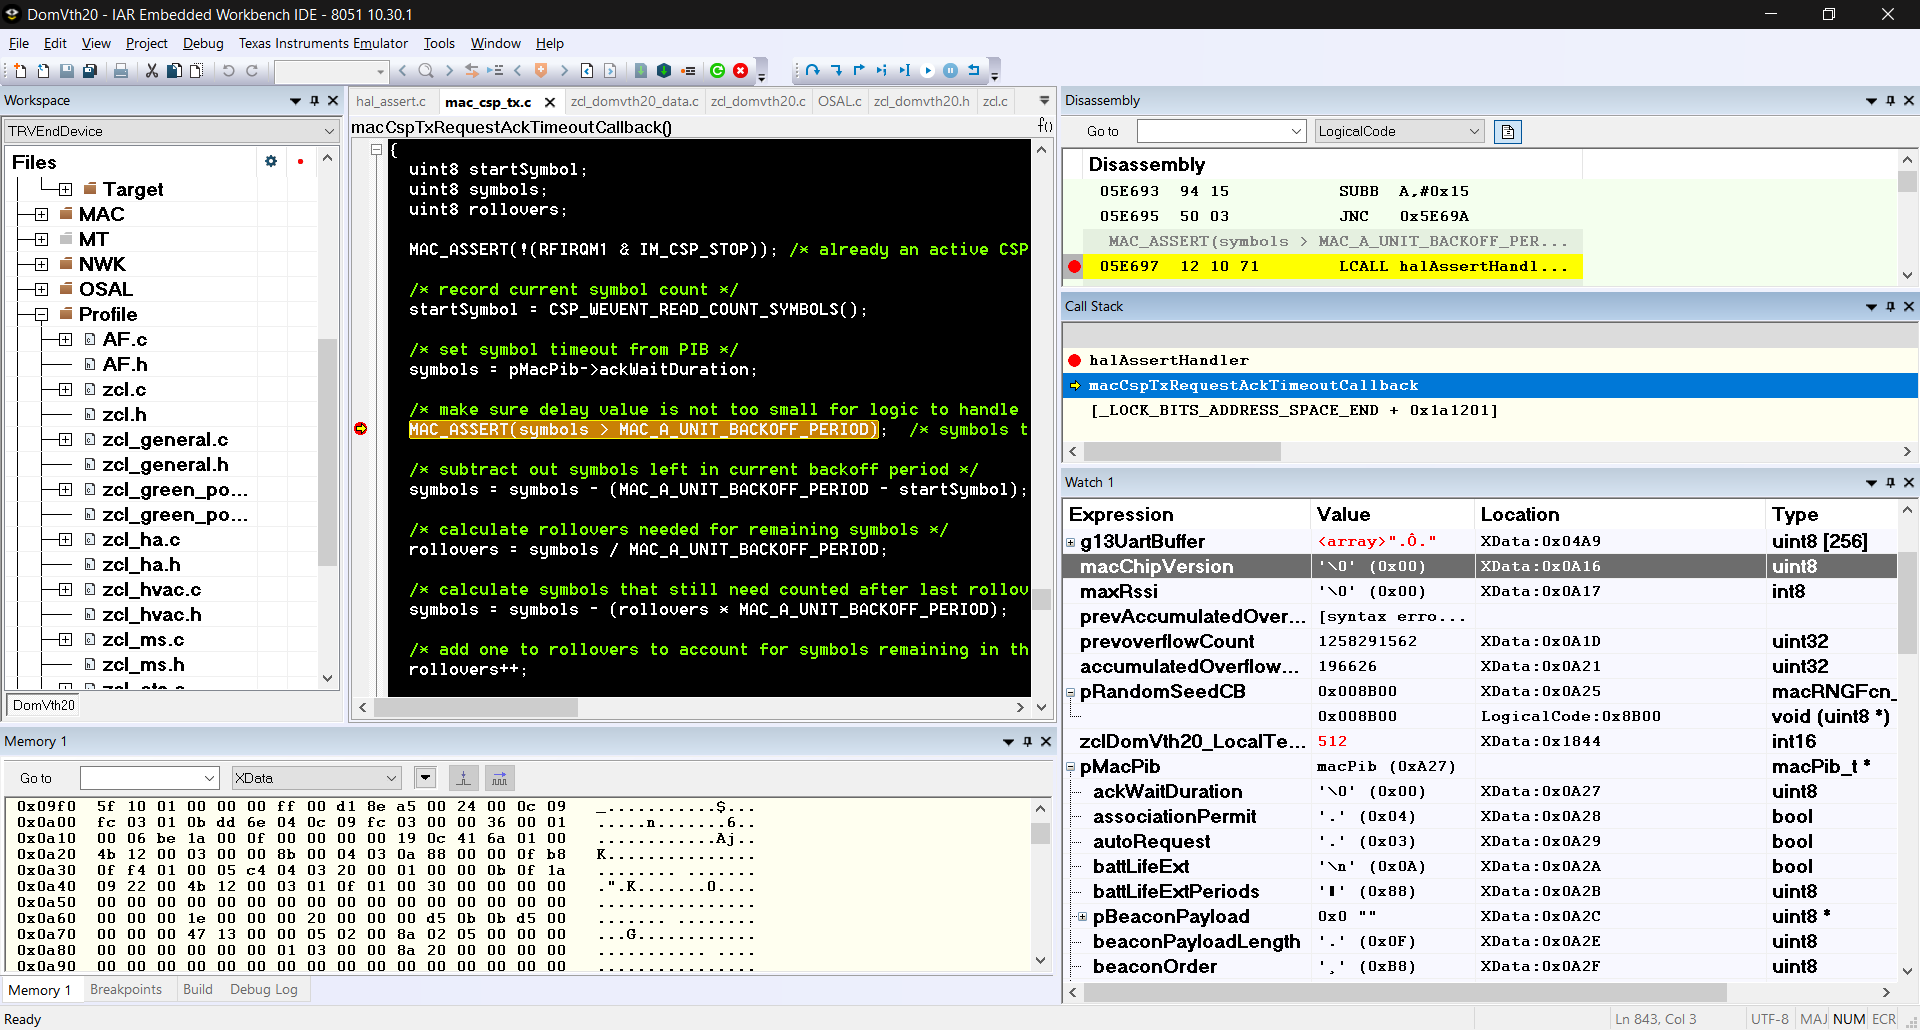
"TheHeap" starts at 0x0FD2
pMacPib points to 0x0A27 where macPib is mapped:
macPib 00000A27 MAC_MlmeResetReq (mac_beacon)
All things being equal, I performed a reset, and added a breakpoint at this location to get an idea of the expected memory and variables contents.
I had to trigger a manual break to get the following:
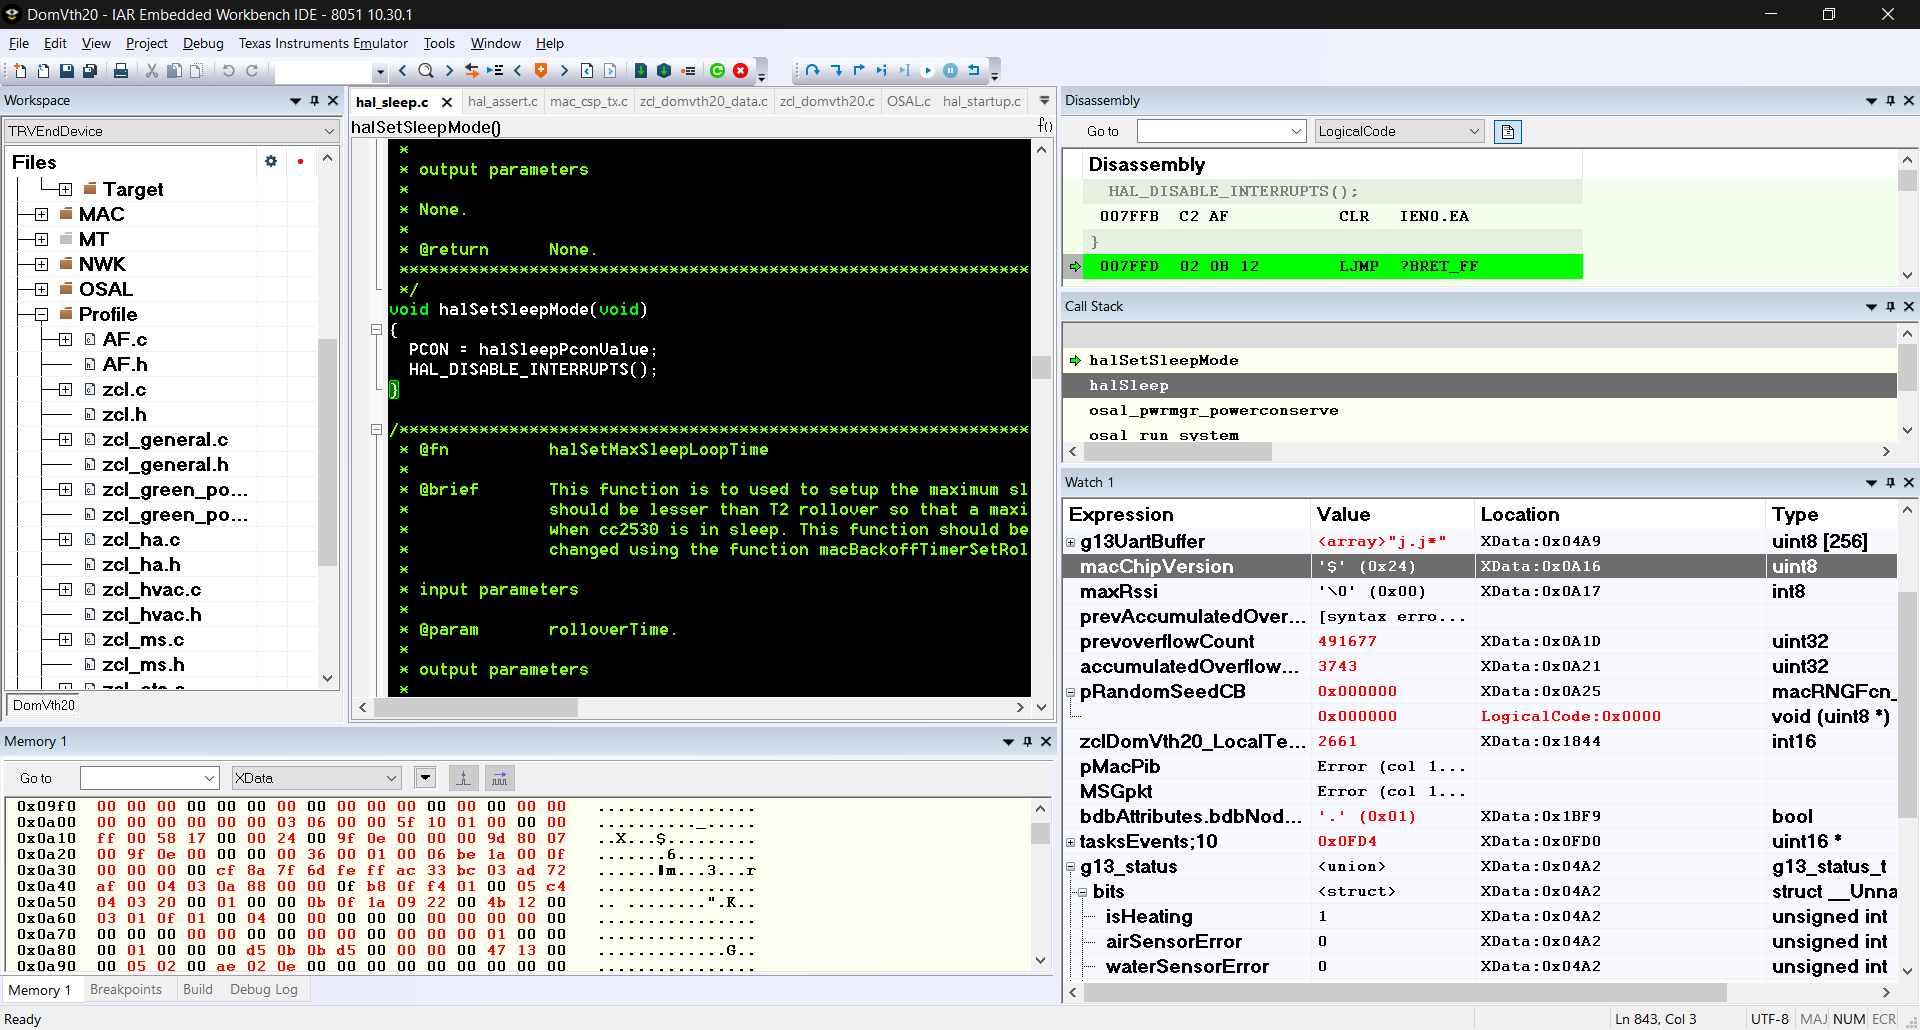
We can see that there is no callback for the random seed that macChipVersion isn't 0, suggesting that this part of the memory has been corrupted.
I further checked the preceding variables and I would only suspect dmaCfg 000005FE
Relative segment, address: XDATA 000005FE - 00000A0B (0x40e bytes), align:
The normal value for dmaCfg.uartCB is 0x105F (@0x0AEA which is the application's call back function but that is not the value when the assert is failing.
This calls for a potential bug in the DMA transmision?
Related question:
Looking at the uartDMACfg_t definition, I see " uint16 rxBuf[HAL_UART_DMA_RX_MAX];" .
Is there any need for the rxBuffer being expressed as uint16, so taking up twice the HAL_UART_DMA_RX_MAX space? Memory being scarce (especially in the ZNP), this could help free some.
Note: I suppose that this uint16 type for the rxBuf is (unfortunately) related to how the DMA hardware probably works...


