This thread has been locked.

If you have a related question, please click the "Ask a related question" button in the top right corner. The newly created question will be automatically linked to this question.

Filling up CC2540's memory

Other Parts Discussed in Thread: CC2540

I'm building off of the keyfob demo application and have run into a memory issue.  

I've gotten to the point where adding more code causes undesirable effects to happen. The device will stop responding or wont even startup properly. I have a decent amount of strings used for debugging purposes via UART but my code size is not extreme. 

I'm using the cc2540f128, how much of that memory is taken up by the bt stack and keyfob example code?

Can someone explain or point to a reference about how DATA, XDATA and IDATA work?  To my understanding:

  • DATA (core RAM) is for high speed variable access and is limited to 256 bytes
  • IDATA is next
  • XDATA is the largest (64Kbytes)
Could it be possible that my XDATA is already filled? Does the compiler determine where to put variables?  
I'm also a bit baffled when it comes to monitoring these memory spaces.  Using the Stack View in IAR, i can monitor the XDATA size.  When a function is called that initializes a 100 byte buffer, I see XDATA jump up.  When the function is finished, I would have expected the XDATA size to drop back down, but it doesn't.  Isn't this the point of function scope and the stack? Is there a more accurate way to measure stack usage
Also, does the CC2540f256 add more program space and XDATA space or heap size?
Thanks for helping out
  • Hi Jonathan,

    When you have compiled your project you can have a look at the bottom in the ".map" file (Output Folder).

    For example, the heart rate example project:

    108 019 bytes of CODE memory
         26 bytes of DATA memory (+ 73 absolute )
      6 089 bytes of XDATA memory
        192 bytes of IDATA memory
          8 bits of BIT memory
        702 bytes of CONST memory

    This information is useful, in that it tells the total amount of code space (CODE memory) and RAM (XDATA memory) being used by the project. The sum of the CODE memory plus CONST memory must not exceed the maximum flash size of the device (either 128KB or 256KB, depending on the version of the CC2540/41). The size of the XDATA memory must not exceed 7936 bytes, as the CC2540/41 contains 8kB of SRAM (256 bytes are reserved).

    For more specific information, the map file contains a section title “MODULE SUMMARY”, which can be found approximately 200-300 lines before the end of the file (the exact location will vary from build-to-build). Within this section, the exact amount of flash and memory being used for every module in the project can be seen. 

    Best Regards

  • uh oh, we got problems

    129 007 bytes of CODE memory
    26 bytes of DATA memory (+ 88 absolute )
    7 827 bytes of XDATA memory
    192 bytes of IDATA memory
    8 bits of BIT memory
    5 151 bytes of CONST memory

    Errors: none = 
    Warnings: 5

    Looks like CODE + CONST = 134158

    and XDATA is creeping up at 7827

    To remedy the CODE situation, I can upgrade to the 256 size chip, but it looks like I can't expand XDATA size, so I'll need to cut down on variable usage in order to trim back XDATA size?

  • Hi Jonathan,

    Yes it seems like you need to take a second look at the RAM (XDATA) usage. Might be that the MODULE SUMMARY can give you a clue where to cut away stuff.

    Best Regards

  • Hey Nick,

    Really interesting stuff in there.  What surprised me is the amount of XDATA that is used by the following:

    • OSAL_Memory  - 3003
    • hal_uart - 1059 (may be inflated due to support of dual uart ports)
    • ll - 443
    • ll_scheduler - 447
    • peripheral - 150
    • N/A (command line) - 895 ??? what's this?
    = 5997 bytes which is 75% of the available usage. Does this seem right?
    Also is the hci api mandatory? Is it too integrated into the osal? Stripping that code save some code space
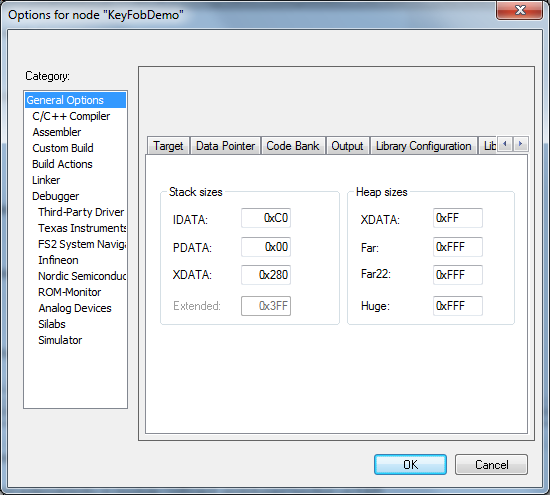
  • Now that you specifically ask about the 'N/A (command line)' size, I find it amusing that IAR chose an abbreviation which usually means "not applicable", because those bytes are very applicable to the amount of XDATA (i.e. RAM) left for other use. Nevertheless, the 'command line' is what is requested of the compiler/linker from the command line options (which include the ide project options which get converted into command line options when the ide invokes the iar compiler/linker). So I don't know why you have 895 bytes above, because when I compile the KeyFob sample app using the xdata stack size of 0x280, which is default (and which you showed in your very first post of this thread) , I get an N/A (command line) of exactly 0x280, or 640 in a more comprehendible format.

    As for the XDATA chewed up by the osal_memory, that is your heap, dynamic memory, since the c-library malloc/free are usurped by the super optimized osal_mem_alloc/free. So you adjust the size of your heap with this pre-define found in the project-->options-->c/c++ predefines:

    INT_HEAP_LEN=3000


  • Okay, so I'm struggling to understand your second paragraph. By default INT_HEAP_LEN=3000. What does modifying this do? Are you saying I can gain more XDATA availability by adjusting this pre-define? 

    Also, If I ever need to dynamically allocate memory, should I be using osal_mem_alloc/free instead of the c-library functions?

  • Giving less XDATA to the heap leaves more XDATA for variables, and vice versa. You cannot allocate too little XDATA to the heap, or the BLE layers won't be able to get (and give back) the memory that they need to function.

    Yes.


  • Interesting information. One last question*

    I've been using the stack window to monitor XDATA usage during runtime. When the code is fully started, XDATA usage is around 10%.  I call a function that creates a local variable (array of 100 characters), and the XDATA usage jumps up.  When the function is done, I would have assumed XDATA usage to jump back down to 10%.  Is pushing and popping local variables off the stack visible when monitoring XDATA?

    *Disclaimer: probably not my last question

  • Hi Jonathan,

    The memory is split into Stack and Heap. The Xdata usage shown in IAR is for the stack.

    For the heap

    a) dynamically allocated with osal_mem_alloc and

    b) statically allocated (global or with keyword static) you'd have to check the usage by

    a) setting the preprocessor define "OSALMEM_METRICS=TRUE" in the project options and then putting a watch on the variable memMax, memAlo etc found on lines 181-185 of OSAL_Memory.c. memMax will show you the maximum ever allocated dynamically.

    b) checking the .map file output after compiling

    Best regards,
    Aslak