Hi Team,
Good day. I am posting this inquiry on behalf of the customer.
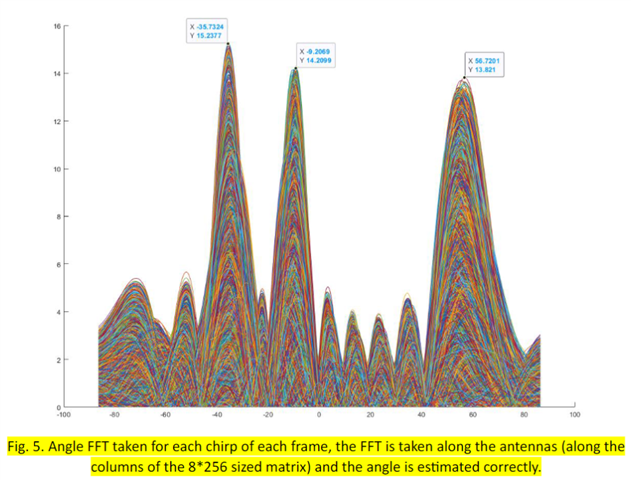
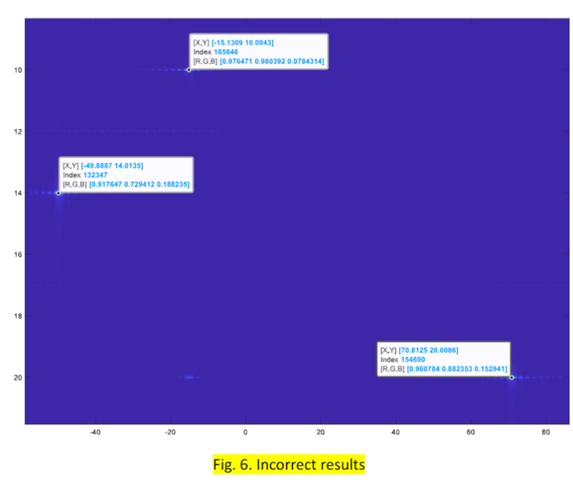
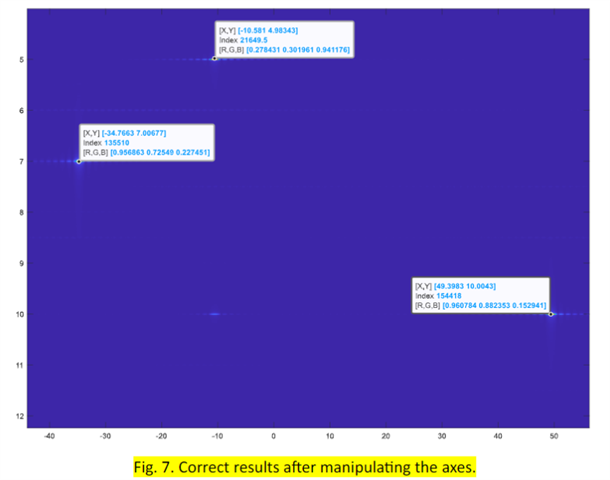
Thank you for extending your support. Your help is much appreciated.
Kind regards,
Marvin
This thread has been locked.
If you have a related question, please click the "Ask a related question" button in the top right corner. The newly created question will be automatically linked to this question.
Hi Team,
Good day. I am posting this inquiry on behalf of the customer.


Thank you for extending your support. Your help is much appreciated.
Kind regards,
Marvin
Hi,
to obtain range-azimuth heatmap I take a 2D FFT once along 256 samples (fast time) to obtain range and once across the 8 antennas to obtain the angle. Is this the right approach?
This is the correct approach to estimate angle. Can you please provide a pseudo code with comments to walk me over how you performed & visualized the heatmap?
Regards,
Kaushik
Hi Kaushik,
Thank you for your response. Please see the response of our customer.
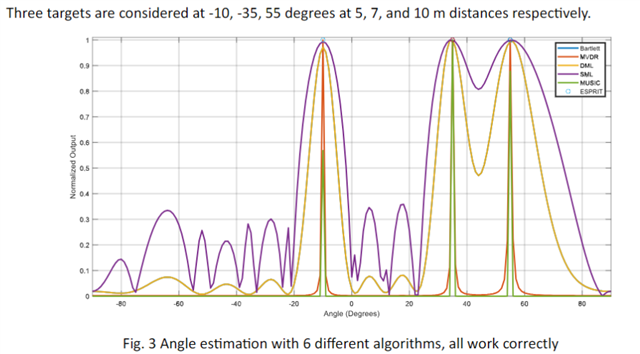
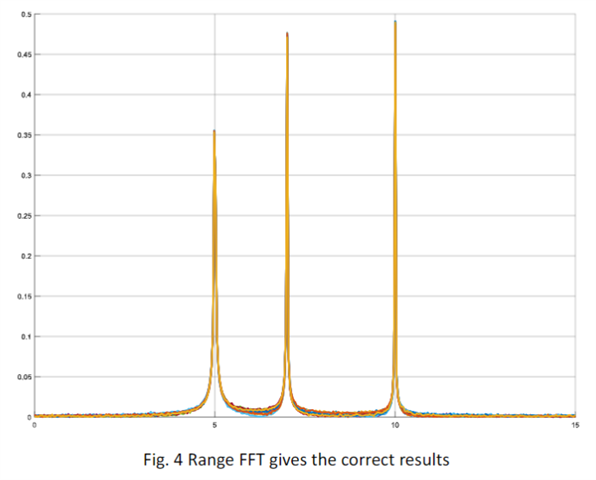
Thank you very much for getting back to me. In the link you provided Kaushik asks for a pseudo code. I am attaching the MATLAB code that I used to generate the figures in my previous file. I will be applying the same code to my measurement data. But since I wanted to make sure that my understanding of the problem is correct, I first applied it to simulated data. Please find attached the .m script file.
Range_Azimuth_Heatmap_E2E_question.zip
Thank you for extending your support. Your help is much appreciated.
Kind regards,
Marvin
Hi Marvin,
I can go through the code and get back to you within two weeks' time. Your patience is appreciated. In the meanwhile, the customer can browse over e2e to gain more info about the same.
Regards,
Kaushik