This thread has been locked.

If you have a related question, please click the "Ask a related question" button in the top right corner. The newly created question will be automatically linked to this question.

Trying to Debug Linux Kernel Using CCS - No Symbols Available

Guru 10685 points

Hi,

I'm trying to step through the Linux kernel using CCS 4.2.3. Here's what I do:

1. Boot into U-Boot environment to stop kernel from booting.

2. Launch configuration and then load symbols in CCS by selecting the vmlinux file (yes, I did compile it with "CONFIG_DEBUG_INFO" and "CONFIG_DEBUG_KERNEL" enabled).

3. Connect to the ARM Cortex A8 in CCS and press F8 to "Run".

4. Load the kernel into memory using the U-Boot command line and boot the kernel.

5.  Once the kernel has started booting halt the ARM in CCS.

6. Fail


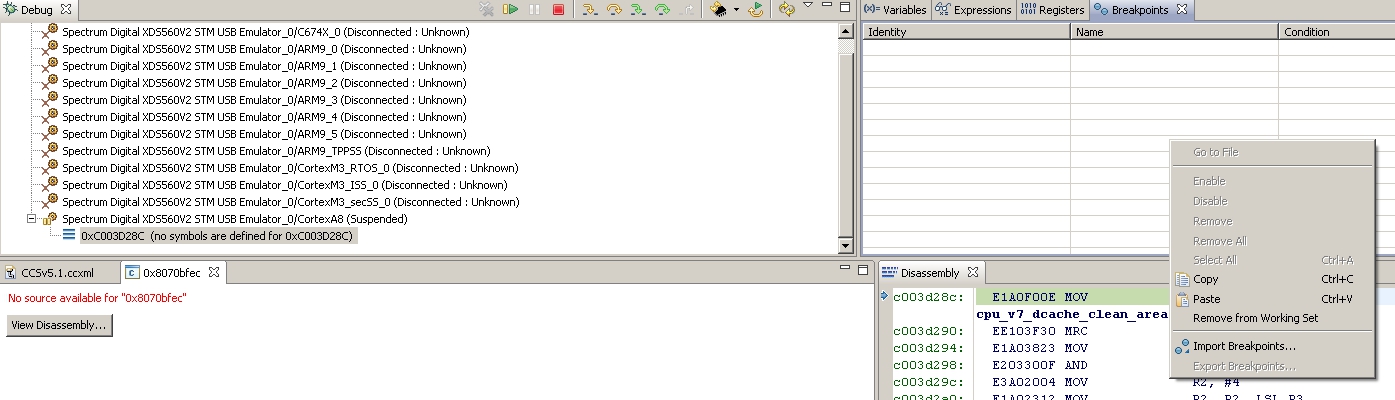
At step 6 I expect to see a reference to a source code ".c" file in the "Debug" pane in CCS but it says nothing particularly useful.

I've set the source path to include the "linux-2.6.7" directory and its subfolders. Here's a screenshot of what I see:


After that I thought I would try running "Enable OS Debugging". This didn't seem to help as I ended up with the following situation:


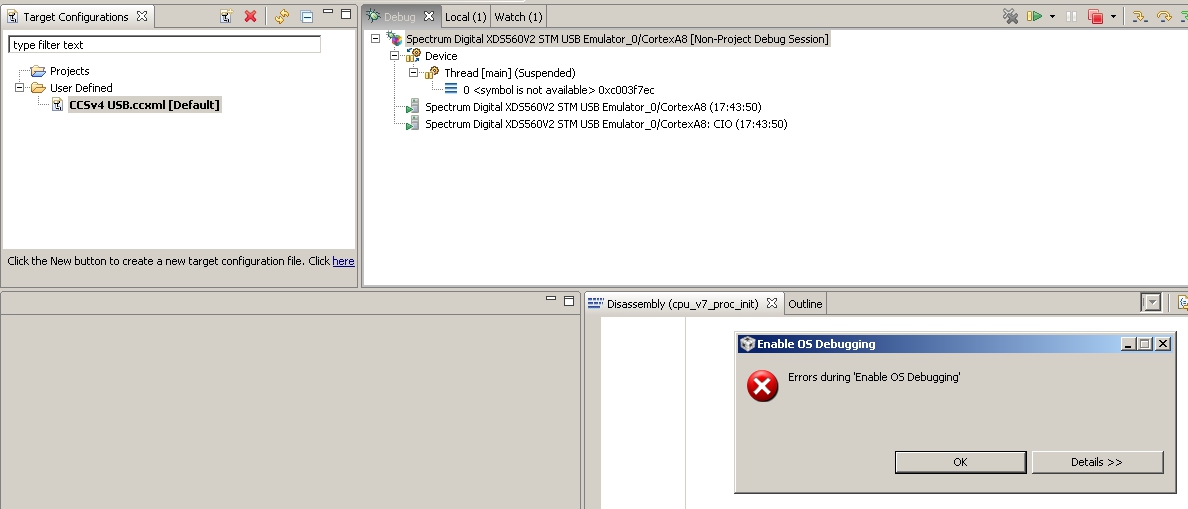
Not shown in the screenshot above is some text in the console pane:

CortexA8: Can't initialize TLD Device Driver: A supported Linux image is not detected on the target: No kernel symbols are detected. Please load the vmlinux symbol file and try again.

Just for sanity, I ran "file" on vmlinux:

build/linux-2.6.37/vmlinux: ELF 32-bit LSB executable, ARM, version 1 (SYSV), statically linked, not stripped

Any ideas?


Thanks,
Ralph

  • Hi Ralph,

    At Step 6, the cpu halts at  http://lxr.linux.no/linux+v2.6.37/arch/arm/mm/proc-v7.S#L77

    The debugger should be able to unwind the callstack and open the corresponding assembly file.

    This tells me that the vmlinux file does not have full debug info.

    A typical vmlinux with full debug info is at least 15 MB.

    How large is your vmlinux ?

    Can you try:

    readelf -S vmlinux  | grep .debug

    and see if there are any non-zero .debug sections in your vmlinux file.

    Regards,

    Raymond


  • Hi Raymond,

    sorry for my slow reply. I've been on holiday.

    Here is the output of that command you suggested:

    readelf -S vmlinux_with_debug_symbols  | grep .debug

      [15] .debug_line       PROGBITS        00000000 4eedd2 22ad21 00      0   0  1
      [16] .debug_info       PROGBITS        00000000 719af3 231eacd 00      0   0  1
      [17] .debug_abbrev     PROGBITS        00000000 2a385c0 118f8b 00      0   0  1
      [18] .debug_aranges    PROGBITS        00000000 2b51550 00a5a0 00      0   0  8
      [19] .debug_ranges     PROGBITS        00000000 2b5baf0 0b8da8 00      0   0  8
      [20] .debug_pubnames   PROGBITS        00000000 2c14898 035be7 00      0   0  1
      [21] .debug_str        PROGBITS        00000000 2c4a47f 13695b 01  MS  0   0  1
      [22] .debug_frame      PROGBITS        00000000 2d80ddc 09dde4 00      0   0  4
      [23] .debug_loc        PROGBITS        00000000 2e1ebc0 2c61ed 00      0   0  1

    How do I tell a "non-zero" section in the above?The file is 53MB big by the way compared to the one I think I have built without debug symbols in which is 7MB big.

    Thanks,
    Ralph

  • Hi Ralph,

    This means that your vmlinux does have all the debug info.

    I just realize that you are using 4.2.3.

    We update the OS driver for 5.1 (but not 4.2.x) recently to support Linux kernel 2.6.34 and up.

    Could you give 5.1 a try ?

    Raymond

  • Ralph,

    Other details that may affect the inclusion of debug symbols in the linux kernel are configured in the build itself.

    In menuconfig, enable the option:

    Kernel hacking ---> Compile the kernel with debug info

    Also, if the kernel is in experimental mode, you should enable the option below:

    Kernel hacking ---> Enable stack unwinding support

    To check if the kernel is in this mode, check if the option below is enabled.

    General Setup ---> Prompt for development and/or incomplete code/drivers

    I verified this in kernels versions 2.6.34 and 2.6.37 (part of the SDKs for OMAP3 and C6A816x devices).

    Hope this helps,

    Rafael 

  • Will 5.0.3 suffice? Do I need to explicitly click on "Enable OS Debugging" and if so when do I do this?

    Thanks,
    Ralph

  • you need 5.1  M5.

    What are you planing to do with OS debug feature:

    1. debug kernel at the cpu level   - you simply load the symbol file and do not need to enable OS debug
    2. automate linux module symbol loading - you need to load the symbol file and enable OS debug
    3. view the process tree - this feature is not available in v5 yet

    -Raymond

  • Rafael,

    are you saying that I must enable stack unwinding, or that it is optional for kernel debugging?

    Raymond,

    as part of my evaluation of the TI816x, the more I can do debugging-wise the better. I certainly would like to do 1. and 2. from your list.

    Thanks,

    Ralph

  • I enabled stack unwinding and already had kernel debugging info enabled. I'm now using the latest version of CCS 5.1.

    Unfortunately CCS is having trouble relating the symbols that I've loaded to the disassembly. Here is a screenshot of the situation once I've loaded the vmlinux as symbols and suspended the ARM once it's booted into Linux.


    What do I need to do next? This seems to be a worse situation than before.

    Thanks,

    Ralph

  • Hi Ralph,

    Can you try to set a breakpoint at the function schedule ?

    Then, resume the target.

    I expect the target will halt very quickly at schedule() and you should see

    the full callstack.

    -Raymond

  • If you are debugging kernel start, you should set the breakpoint at  start_kernel.

    -Raymond

  • Please forgive my ignorance but in which source file do I find "schedule" and "start_kernel"?

    I tried searching for them and found numerous instances of them but am having trouble finding the functions themselves.

    Thanks,
    Ralph

  • You do not have to browse the specific file to set a break point.

    After you connect to A8,

    1. select the A8 device from the debug view
    2. bring up the breakpoint view  (View->Breakpoints).
    3. add a new breakpoint
    4. enter the name of the function at which you want to halt

    Regards,

    Raymond


  • I cannot add any breakpoints. See what happens when I right click in the "Breakpoints" window:

    Cheers,

    Ralph

  • click this icon to bring up a dialog to enter the function name

  • Okay, I'm getting somewhere now.

    I added "schedule" and it breaks at "asmlinkage void __sched schedule(void)" very quickly if I add the breakpoint after Linux has booted and the sched.c file appears in CCS however any attempt I make to step over this function causes the disassembly to be brought up and the sched.c source file gets shifted out of sight to the background.

    I can't get it to break at "start_kernel" at all (I assume it should be breaking here immediately after U-Boot loads the kernel).

    Just to reiterate what I'm doing:


    1. Boot into U-Boot environment to stop the kernel from booting.

    2. Launch target configuration in CCS.

    3. Select the Cortex A8 and “Run->Load->Load Symbols” and select “/home/ralphc/ti_davinci/build/linux-2.6.37/vmlinux”.

    4. Connect to the ARM Cortex A8.

    5. Bring up the breakpoint view using “View->Breakpoints”.

    6. Click on the button consisting of a trio of blue circles above the “Breakpoints” pane and enter “start_kernel”.

    7. Press F8 to "Resume".

    8. Boot Linux.

    Is this not working because I set the breakpoints while in the U-Boot environment when the kernel has not been loaded yet?

    Thanks,

    Ralph

  • To debug boot issues, you need to set hardware breakpoint

    http://processors.wiki.ti.com/index.php/Debugging_Boot_Issues#Use_Hardware_Breakpoints

    At step 6, instead of click the button, click on the down arrow beside the icon to select hardware breakpoint.

    set the bp to start_kernel.

    Then at step 8, the debugger will halt at start_kernel.


  • Hi Raymond,

    it now catches the start_kernel function thanks to the hardware breakpoint. Thanks a lot.

    While I'm here, as I step over the source file it jumps about quite a lot. Is this anything unusual due to e.g. too much optimisation when I built the kernel, or is this normal behaviour and just due to hardware interrupts etc?

    Ralph