This thread has been locked.

If you have a related question, please click the "Ask a related question" button in the top right corner. The newly created question will be automatically linked to this question.

How do I setup CCSv4 to use ETB with TMS320C6474 and XDS510

Other Parts Discussed in Thread: TMS320C6474, CCSTUDIO

Hello,

I have been investigating a problem with exceptions and have come to the end of the road with normal breakpoints. I now would like to use trace as a logic analyser to tell me what code was executing prior to the exception occuring.

I am using:
    CCS v4.2.5.00005
    Specturm Digital XDS510 USB
    custom PCB with TMS320C6474

I understand that I don't need and XDS560, and that I can use trace with an XDS510 with the ETB module.

The data manual SPRS552H states "The C6474 device supports Trace". I take this to mean that I can use ETB with the C6474.

I found a silent video showing how to use trace: http://software-dl.ti.com/dsps/dsps_public_sw/sdo_ccstudio/CCSv4/Demos/TraceCodeRunaway.htm

But having set the trace points, I get error messages in the error log.
In the debugger, if I try and access the Tools->Trace Control menu I get the error:
An error occurred connecting to Channel Server. Make sure this target supports tracing and it's connected. Native error message: ' Channel server creation failed.'

I have checked the project .tcf file for settings that might be involved:
Global settings: "Enable Real Time Analysis" and "Enable All TRC Trace Event Classes" are enabled.
Instrumentation: I had an entry called trace with data type "printf". I added another with data type "raw data" just in case it was needed.
Input/Output: RTDX is enabled. HST is enabled using RTDX.

After much searching on Google, I have put together enough snippets of information to work out that I need to add an ETB node to my project's target configuration so that the debugger has something to talk to.

I did find a wiki page for CCSv5 explaining how to do this on an early version of CCSv5 (http://processors.wiki.ti.com/index.php/Adding_an_ETB_Node_to_the_CCSv5_Target_Configuration), and I have tried to use this as a guide for what I should expect.
But it seems to be too different to work under CCSv4.


I have tried various methods of adding the node, but most failed to give a debugger session that could be launched.
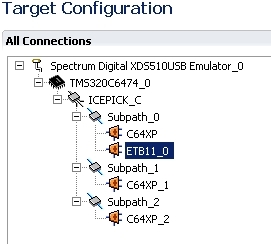
The best attempt I have managed, is to add an ETB_11 cpu node to the subpath that contains the core_0 processor I am working on:
- Spectrum Digital XDS510USB Emulator_0
  - TMS320C6474_0
    - ICEPICK_C
      - Subpath_0
        - C64XP
        - ETB_11_0
      - Subpath_1
        - C64XP_1
      - Subpath_2
        - C64XP_2

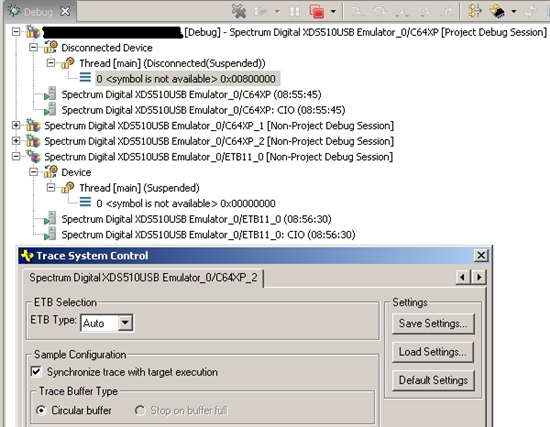
Having done this, I can launch the debugger, and the three cores connect as usual. At the bottom of the list of cores is a new entry for the ETB_11:
- Spectrum Digital XDS510USB Emulator_0/ETB11_0 [Non-Project Debug Session]
  - Disconnected Device
    - Thread [main] 9Disconnected(unknown))
      0 Symbol not available
    Spectrum Digital XDS510USB Emulator_0/ETB11_0 (11:30:27)
    Spectrum Digital XDS510USB Emulator_0/ETB11_0:CIO (11:30:27)

If I disconnect core_0, and then connect to target on the the ETB entry, I can access the Tools->TraceControl menu.
But, I can't then load code into the ETB entry, or re-connect to core_0.
(If I don't disconnect core_0, I get lots of errors when I connect the ETB_11.)

So the questions I have are:

  • Does the C6474 really support ETB?
  • Is there anything else I should have setup in the
  • tcf file or
  • project settings?
  • Should I be adding a node in the target configuration?
  • If so, how?
  • Is there a document or FAQ that actually tells me how to do all of this?
    (So far I have only found bits of the puzzle spread out through the TI web site in a mixture of pdf files, Wiki pages and E2E questions. I never found the Trace Quick start guide that should have been in the CCS help.)


Regards - Paul

  • Paul,

    On C6474 the main use of trace has been in conjunction with a trace receiver like the XDS560T (the T part is important).  There is an ETB on the device.  I will see if I can get a trace expert to confirm but I believe you can only make use of ETB on C6474 if you are using CToolsLib.  CToolsLib is a set of libraries you can embed in your application and control the various debug features of the device.  http://processors.wiki.ti.com/index.php/CToolsLib

    Regards,

    John

  • Paul,

              I do not have C6474. But I have tried ccsv4.2.3, ccsv4.2.4, and ccsv4.2.5 on C6488 and C6472 EVM with SD 510 USB emulator. DSP Trace works fine.

             You don't need to add ETB nor include any additional gel files. Everything should work as it is.

             The particular error that you received is saying "Trace Server" is not created properly. This seems to me some installation issues.

             What is to OS?

             What is the installation directory?

             After you bring up trace control, please open window's task manager. do you see a process called "TraceServer"? If not, then that is why you are getting that error. we can start debug that issue from that point on.


    zhenyu

  • zhenyu wang said:

    Paul,

              I do not have C6474. But I have tried ccsv4.2.3, ccsv4.2.4, and ccsv4.2.5 on C6488 and C6472 EVM with SD 510 USB emulator. DSP Trace works fine.

             You don't need to add ETB nor include any additional gel files. Everything should work as it is.

             The particular error that you received is saying "Trace Server" is not created properly. This seems to me some installation issues.

             What is to OS?

             What is the installation directory?

             After you bring up trace control, please open window's task manager. do you see a process called "TraceServer"? If not, then that is why you are getting that error. we can start debug that issue from that point on.


    zhenyu

    Hi John and Zhenyu,

    Thanks for your replies.

    I feel more hopeful after Zhenyu's lead that ETB does work on the C6488 and C6472  - thanks zhenyu!

    Its very confusing reading the documentation, I was worried that I had to add code to my app for the ETB to work, so thanks for confirming that I should not have to.

    Zhenyu, it could be an installation issue, but I thought that since I can get the Tools->TraceControl menu to work by adding the ETB_11 node in a particular way, I think the problem is how I am trying to use CCS.

    My PC OS is Windows XP 2002 SP2.

    My installation folders are:

    • C:\Program Files\Texas Instruments\ccsv4
    • C:\Program Files\Texas Instruments\bios_5_41_10_36
    • C:\Program Files\Texas Instruments\C6000 Code Generation Tools 6.1.19

    I have TI network / maths libraries in a root folder:

    • C:\ti\C6000\c64plus-dsplib_2_02_00_00
    • C:\ti\C6000\C6000_ndk_2_20_04_26

    I started with a legacy skeleton project that was built in CCSv3.3, hence I also have the following CSL:

    • C:\CCStudio_v3.3\boards\evmc6474_v3_3_1\csl_c6474

    Task manager. I do have a TraceServer.exe process in the Task Manager. It is created when I launch the Target->Debug Active Project menu.

    (It is present even when I do not have an ETB_11 node in my ccxml file.)

    If I do not have an ETB11 node in my ccxml file, I get an error when I click on Tools->Trace Control.

    If I add one as below:

    I can reach the System Trace Control dialog box, BUT only if I disconnect core zero and connect ETB11 instead:

    Having disconnect core zero, I can't load a program and run it.

    I think I am quite close to making this work.

    I suspect I am not setting up the ccxml file correctly.

    Any more thoughts?

    Regards - Paul

  • Hi,

    John I was searching on Google for any other clues about using the ETB without an XDS560T and found another thread where you laid out a very comprehensive set of instructions for using ETB with CCSv5.

    http://e2e.ti.com/support/development_tools/code_composer_studio/f/81/t/164235.aspx

    It looks like the things you were doing there might be the missing step(s) that I need. There was no mention of the type of XDS in use, hence I thought it might be worth trying to follow your instructions.

    Quote:

    Select Edit <Session> where session will be the name of your debug session.  This will open a big dialog box.  On the right will be a list something like: CPUs, Non Debuggable Devices and Routers.

    I found that the right click on first node -> edit <session>,  gave a large dialog box, but that box did not have the items indicated on the right hand side. (I tried looking around and could not find anything similar)

    Is there a way to do this in CCSv4, or again is it because I have missed a step in the ccxml file setup prior to this?

    Also, I clicked on right click on first node -> Set Debug Scope, and now I can't see my other two cores in the debug view. How do I get them back?

    Regards - Paul

  • I have managed to cancel the set debug scope. Not sure what I did to fix it, but a combination of closing CCS and launching a few times seemed to do the trick.

  • Paul,

    Those steps were for a different device.  The steps vary device by device.  I haven't used ETB on this device before.  Zhenyu is the main trace expert, I usually steal his instructions and try them out.  ETB should be usable with any emulator as it is just a matter of reading memory.  Pin trace where it is streamed off pins requires a trace receiver like 560T.

    John

  • Hi everyone,

    I really would like to get the trace working - I have now run out of other techniques to debug my code.

    Can anyone help me?

    Paul

  • Paul,

              Let's do a webex to resolve your problem.

              please send me your contact information to: zhenyu.wang@ti.com

    zhenyu

  • Just noting that this thread was resolved offline.

  • Hello JohnS,

    As far as I am aware (and I was the one trying to use the Trace), it was not resolved.

    Zhenyu kindly helped me offline and I was able to get the trace to work, but I can't reproduce it on a new project or on another existing project. All along I have suspected that I need to be told the missing step for how to set up the trace.

    I am currently of the opinion that all the messing around I did trying different ideas from different web pages for different versions of CCS, managed to make some small change for the project that then meant trace worked as per the example in the silent video: http://software-dl.ti.com/dsps/dsps_public_sw/sdo_ccstudio/CCSv4/Demos/TraceCommon_ETB.htm

    The last communication I received from Zhenyu was on the 7th March 2012:

    It seems like there is some kind of timing issue. We have seen this kind of problem before but we should have fixed it. Can you remind me what ccs version are you using now? What is your OS (win XP or win 7)?

    I have not received a reply since then, and I have now moved on from this task and will be unable to try out any more suggestions.

    It really is a shame that you have this fantastic facility in the processor, but I can't get at it. With the trace working (by luck after my messing around with the instructions for other CCS versions) I was able to reproduce the logical diagnosis of my exceptions in a matter of hours - this same diagnosis cost us weeks to diagnose without trace.

    Regards - Paul

  • Paul,

    Thanks for the clarification.  I was under the impression from Zhenyu that this was resolved.  I will find out if a bug has been filed/fixed for the timing issue.  Our documentation and instructions for trace are something that we do plan to clean up this year.

    Regards,

    John