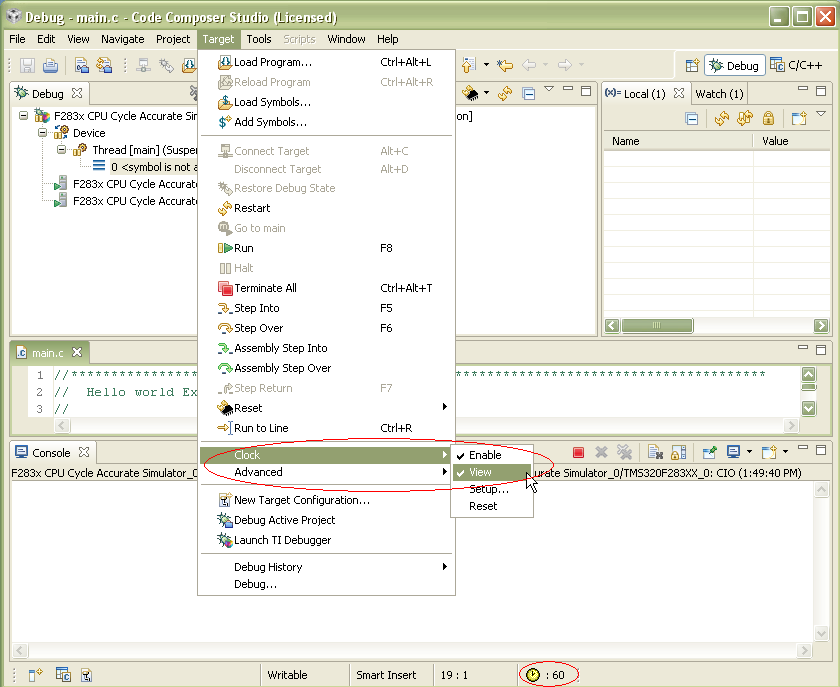
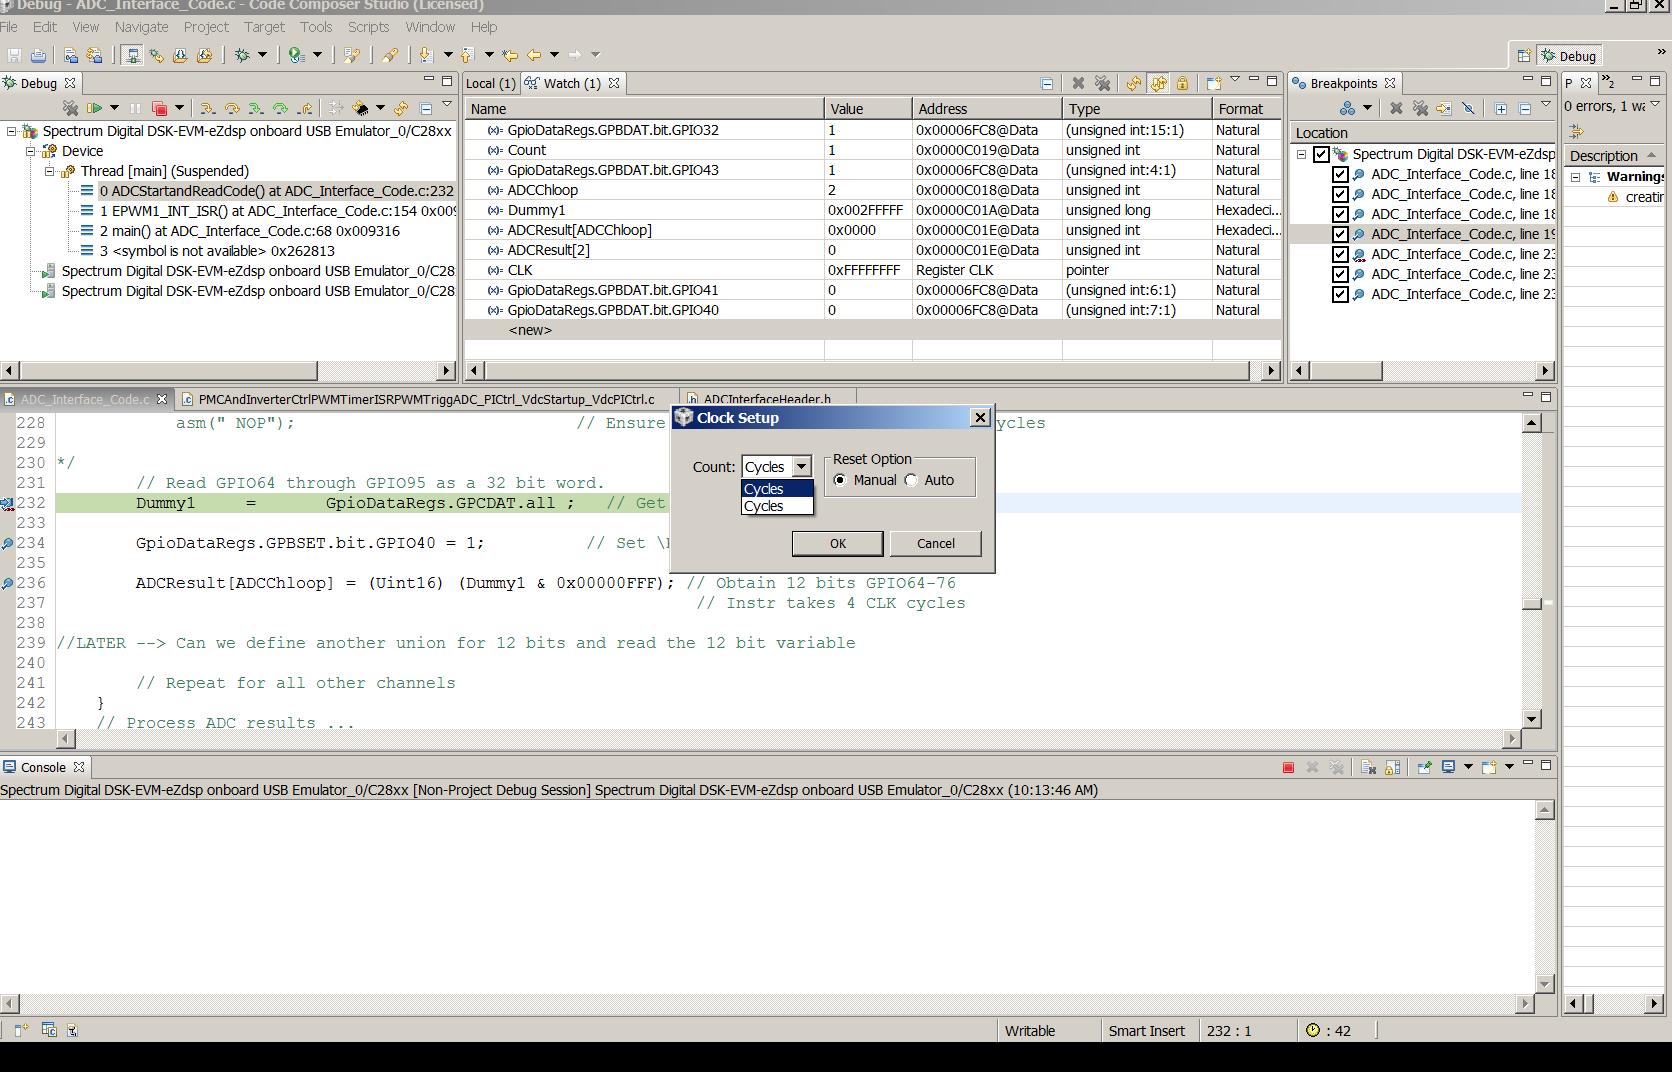
In CCS3.3 there was a function to measure the number of clock cycles between two breakpoints (Profile ==> Clock ==> Enable, Profile ==> Clock ==> View).
How do I perform this task under CCS4.1?
Thank You.
In CCS3.3 there was a function to measure the number of clock cycles between two breakpoints (Profile ==> Clock ==> Enable, Profile ==> Clock ==> View).
How do I perform this task under CCS4.1?
Thank You.