This thread has been locked.

If you have a related question, please click the "Ask a related question" button in the top right corner. The newly created question will be automatically linked to this question.

First base on TINA with noise, what does it mean?

Other Parts Discussed in Thread: TINA-TI, OPA637

I've been designing electronics for decades, but have very seldom done formal noise analysis.  I've drawn an initial schematic in TINA (version 9.3.50.40 SF-TI) and I've gotten out a plot of SNR.  

I did recent research so I know what V/sqrt(Hz) means.  I thought that meant that if I square my bandwidth and multiply it by the V/sqrt(Hz), I would get noise in simply Volts.  I thought that was a scalar result.  However, TINA is reporting curves along a frequency axis for both Total noise (V) and SNR.

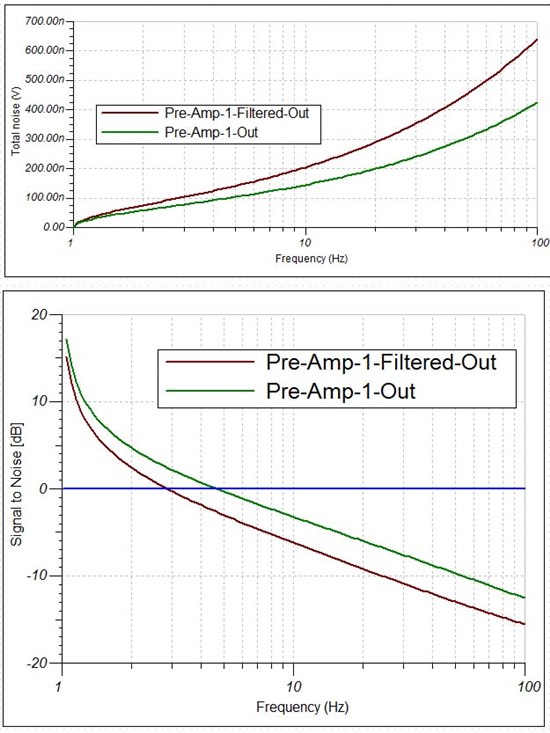
Does this possibly mean that I pick a single frequency on this scale, and that Total noise (V) at that point becomes the scalar I'm seeking?  Specifically, if my bandwidth is 5Hz (yes, very slow), then I look on the graphs to find my "Pre-Amp-1-Filtered-Out" with about 142nV of noise, and an SNR of about -3.24dB (0.688, less than one, using 20log, get confused about 20log vs 10log sometimes).

Is that right?  142nV of noise and SNR = 0.688?  This DOES INDEED match up with the ballpark I expect at this point.

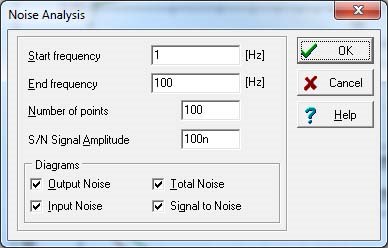
Also, I set the noise analysis S/N SIgnal Amplitude to 100nA.  This is the output level I expect from the input of 1pA and the 1E5 gain.  Was that the right thing to do?  It did put my SNR = 0.688 at a believable level, relative to some hand calcs and some excel calcs I've done in the past.

Or am I totally missing something?  

Thanks very much for your help.

I don't see how to attach the actual project, so I'll attach what I believe is enough info in images to fully describe it.

  • Hi Helmut,

    I will try to answer some of your questions:

    Question: However, TINA is reporting curves along a frequency axis for both Total noise (V) and SNR. Does this possibly mean that I pick a single frequency on this scale, and that Total noise (V) at that point becomes the scalar I'm seeking?

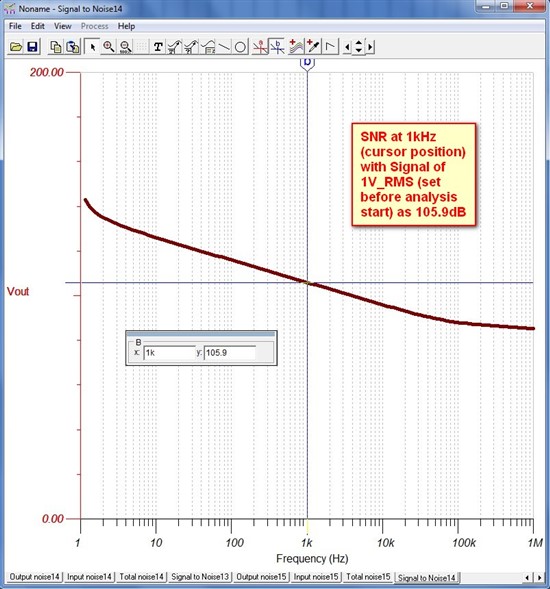
    Answer: TINA-TI SNR plot (called "Signal to Noise") vertical axis is in dB (even though it does not explicitly state that). Here is what TINA-TI help file states:

    Another measure of noise, the “signal to noise ratio,” takes the signal magnitude into account. This is the ratio of signal power to noise power, according to the following formula:


    where VTot is the total input-referred noise voltage and VSig represents the expected signal amplitude. VSig is a user-defined value that you enter in the Noise Analysis dialog. The default value is 1V.

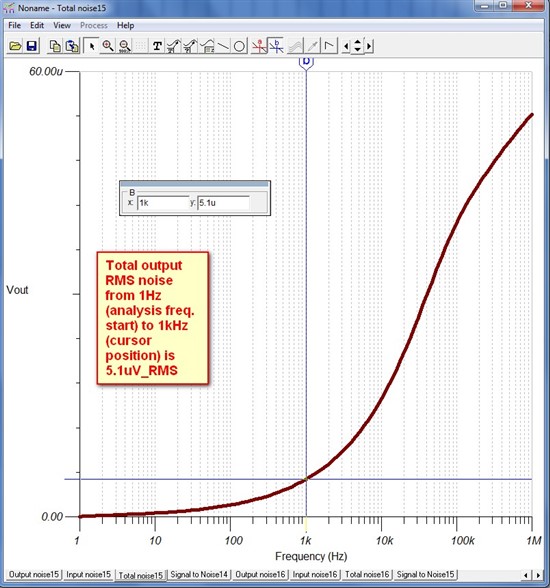
    TINA-TI "Total Noise" plot is RMS noise from the analysis start frequency up to the x-axis value (or if you use a cursor, the cursor frequency).  "Input Noise" and "Output Noise" plots are in V/RtHz (or A/RtHz if you have selected a current source as your input, or if you've designated a current value as your output, respectively).

    So, if for example, your Total Noise cursor placed at 1kHz reads 5.1uV_RMS (shown below), and you chose "1V" for your S/N analysis, you will read 105.9dB in SNR (=20*log(1V / 5.1uV)= 105.9dB).

     Hope this answers your questions.

    BTW, you can upload your TINA-TI files (*.tsc) onto E2E by selecting the paper clip icon (Insert File) when you are posting.

    Also, here is an Analog Wire blog on TINA-TI and its noise capabilities, for reference:

    http://e2e.ti.com/blogs_/b/analogwire/archive/2014/04/09/what-you-always-wanted-to-know-about-tina-ti-but-were-afraid-to-ask-part-3.aspx


    Regards,

    Hooman

  • Hooman,

    Thanks VERY much for the information, and for engaging with me on the question.

    Unfortunately, I already knew pretty much everything you wrote, and what you wrote does *not* *appear* to answer my actual question.  I'll try to rephrase the question...

    I should be able to end up with a single scalar number for SNR, like "3" or "9.5 dB", *not* a graph from which lots of different numbers could be extracted.  

    I'll use your graph examples.  On your second graph, you pointed out the value of the curve of 105.9dB at 1kHz.  On its own, that doesn't have the meaning I need.  However, is the following true.  Assume I have a brick-wall low pass filter with a cut-off of 1kHz.  So only noise between DC and 1kHz can get through.  Would my single scalar SNR number that I need be exactly the 105.9dB pulled from this curve?  (And if it's not a brick wall filter, then ENB needs to be considered.)

    Thanks very much,

    Helmut

  • Hi Helmut,

    Ok. Then let's try and answer your question.

    The scalar value that you are looking for is the output noise plot squared first, then integrated over the bandwidth of interest (assuming a brick wall filter), and then you take the square root of the results. In other words the RMS value of output noise. Hooman added 6/13/14: This is in turn would then need to be multiplied by the SQRT of the bandwidth of interest to arrive at the single scalar (total output noise) number you are looking for.

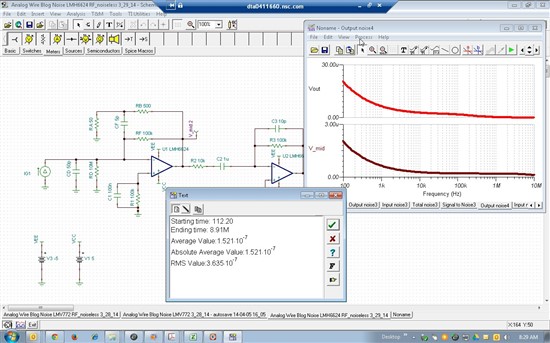
    You can get that by clicking on the output plot, then selecting Process, then Averages  from the waveform display panel top menu (where my mouse is in the picture below) and you would then see RMS value (over the specified frequency range in Noise Analysis):

    If the filter response is something other than a brick wall, and you don't have it in TINA-TI signal path, use the information in the blog link below (related to "Frequency Variable Source") and insert its Laplace transform within the signal path to shape your noise accordingly. Then, you do the RMS method above on the modeled filter output to get the properly "weighted" response:

    http://e2e.ti.com/blogs_/b/analogwire/archive/2014/05/30/what-you-always-wanted-to-know-about-tina-ti-but-were-afraid-to-ask-part-4.aspx

    If you send me your TINA-TI file (*.tsc) along with the transfer function of your filter (if not included in your simulation file), I could show this on your circuit.

    Regards,

    Hooman

  • I forgot to mention that in my last post, this is the reading you get:

    RMS value in that picture is 3.635E-7 (volt), 0.364uV_RMS Hooman added 6/13/14: with units of uV/RtHz

    Also, I did the processing here on the output noise density plot to get the total RMS (integrated) noise result. Hooman added 6/13/14: Don't forget to multiply the computed RMS noise density value by the sqrt of the bandwidth to get the total output noise over that band.  If you know your signal swing at the output, you then divide these by each other (be careful to keep signal and noise both in RMS or both in peak-to-peak) to get SNR. If I recall, peak to peak noise is something like 6 x RMS_noise. I don't think you could take the SNR plot RMS value directly (but I have to think about it some more to see if the squaring of the values causes any arithmetic errors or not?). I will update this later on today after I try it on an example.

    Regards,

    Hooman

  • (((This post has been edited to make it correct, based on the subsequent response from Hooman.  These edits are in red.  My doing this may help others see the full correct picture in the future.  All I was missing was dividing by the square root of the bandwidth, which I knew about but forgot to apply. )))

    I appreciate your continuing to bear with me on this.  Hopefully I've inserted the TSC file correctly at the bottom of this post.   But I'll go through it piece by piece here...

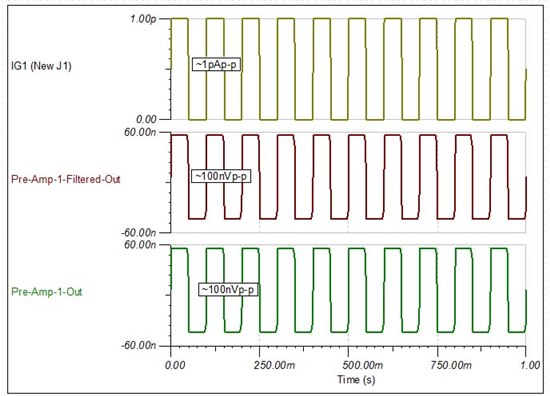
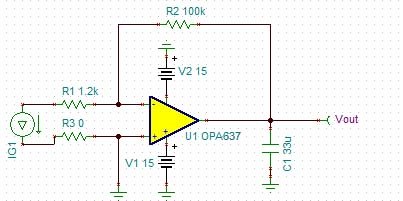
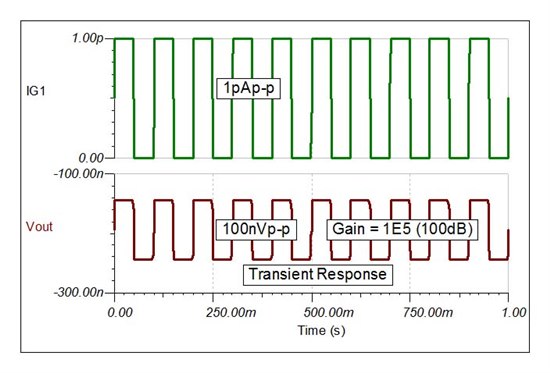
    This should have 1E5 (100dB) gain, and it does.  See below.  I put in 1pA (peak-to-peak) and get out 100nV (peak-to-peak)

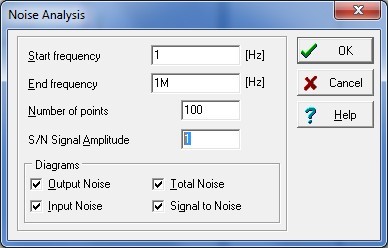
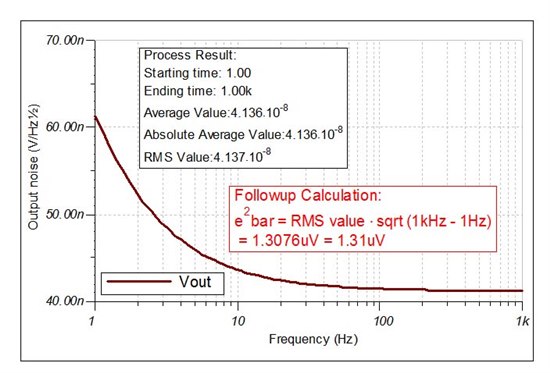
    So then I run the noise from 1Hz to 1kHz.  See below.  I do the process on it just like you suggested, Hooman, and I get an RMS value of 4.137E-8.  That's 41.37nV rms.  So good so far.  I understand how this plot is V/rtHz as noise spectral density.  

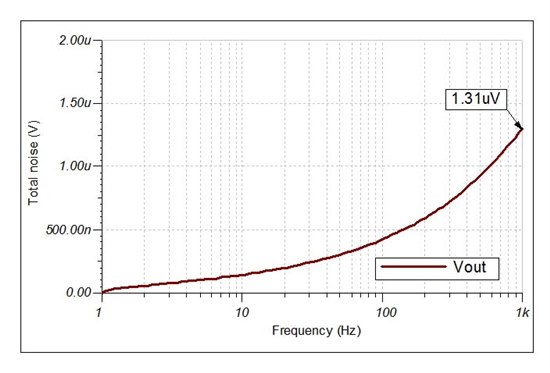
    So, I can take the 41.37nV rms value above, multiply it by the square root of the bandwidth, as sqrt(1000-1) = sqrt(999) to get e2bar = 1.31uV.  This exactly matches the "Total Noise" graph below.  SUCCESS!  Note that this bandwidth is from the analysis start frequency of 1 Hz to the analysis end frequency of 1kHz.  Narrower can be calculated, but the TINA Process command only does the full window for you.  Also, if you specify a greater number of sample points and end up with an analysis starting at, say 0.01Hz rather than 1Hz, you still come up with the same value for the first 3 decimal places.  So that gap on the left near the vertical axis, omitting the info below 1Hz, is not hurting us, at least not in this case and probably not in most cases.

    But after this, things are less what I expect.  The "Total Noise" is below.  If this graph is showing what I think it's showing, then the 1.31uV over on the right at 1kHz should equal the 41.37nV rms value from the process above.  But it doesn't.  I thought the "total noise" was exactly this square/sum/root.  In fact, your red-on-yellow description in your first image earlier descrived the "total noise" as "Total output RMS noise from 1Hz (analysis freq. start) to 1kHz (cursor position) is 5.1uV_RMS".  So I don't understand the disparity between the prior 41.37nV rms and the 1.31uV.  I thought I could calculate my way from the prior to the next graph.  But it's not working as I would think.

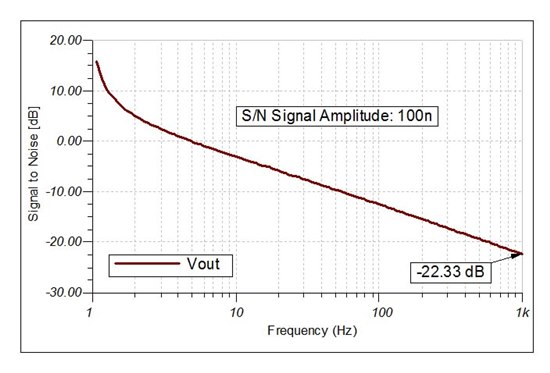
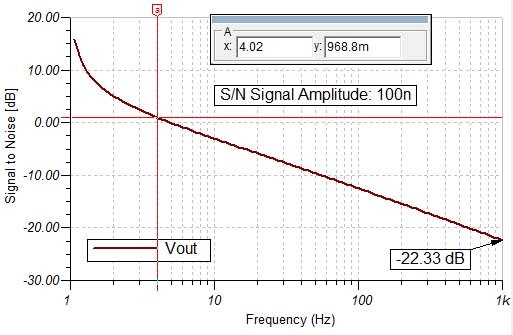
    Move forward anyway.  Move forware with glee.  Below is the SNR plot, using a signal amplitude of 100nV.  I got that 100nV from my transient analysis (and my design expectation).  It's the output when I have a 1pA peak-to-peak input.  Note the value at 1kHz is -22.33 dB.  (I realize I should run again with output rms rather than p-p, but pretend for now my interest is indeed in 100nV rms.)  Here I find SUCCESS again.  SNR = 20log(100n/1.31u) = -22.35.  That's close enough to the -22.33 dB below.

    So I was able to calculate from the "output noise" to the "total noise" plot and then further to the "SNR" plot successfully.  But I couldn't calculate correctly from the "output noise" to the "total noise".

    Were I able to calculate as I expect from "output noise" to "total noise", then I think my very original question should be answered with a "Yes".  That is, any point on the "total noise" curve is calculated as the rms-summed of the "output noise" from DC to that frequency point (NOT CONFIRMED).  So by definition, if I had that brick wall filter with a cut-off at this frequency point, then the "total noise" at that point is indeed my noise, in volts rms.  Divide it into my signal and take 20log to get SNR.  And since this is exactly how the "SNR" plot relates to the "total noise" plot (CONFIRMED), then the single point on the SNR curve for my desired frequency point (aka brick wall cutoff) is that single scalar number SNR I should experience.

    So, I still need to confirm getting from "output noise" to "total noise".  And if it turns out my understanding of that is correct, then my original question as repeated should above should be answered with "yes".

    So, back to my very first question.  I believe the following is TRUE.  If I have a brick wall LPF at some frequency, then the single scalar number for SNR that I should experience will be the single scalar number I pull off of the SNR plot, for the frequency equaling this brick wall cut-off frequency.

    For example, in this example, imagine my LPF cuts off at the very low 4.02 Hz.  Pulling from the graph, the SNR is 0.9688 dB = 1.12.  That's just a hair above 1 and good enough for my project.  You can see this reading of the graph below.  This means that if I were to push this into such a brick wall LPF, I would end up with a satisfactory SNR for my final output given that 1pA p-p input, because my spec is to achieve at least SNR = 1.  After all, 1pA -pp is very, very small.

    In real life, of course, my LPF won't be brick wall.  There's ENB (Equivalent Noise Bandwidth) to deal with.  You can read about at http://www.ti.com/lit/an/slva043b/slva043b.pdf , as well as read about the theory implied in this post.  Use the ENB instead of the LPF bandwidth of fc.  Below is a table from the same pdf:  This will be an approximation...

    FILTER ORDER ENB
    1 1.57
    2 1.11
    3 1.05
    4 1.025


    6406.NOISE TEST.TSC

  • Hello Helmut,

    The RMS value computed (41.4 nV/RtHz) is the "effective" noise over that frequency band. In order to arrive at the total output noise, you then need to multiply this "effective" value by the the SQRT of the bandwidth (1kHz - 1Hz):

    Vout_RMS= 41.4nV/RtHz x sqrt (1kHz - 1Hz) =  1.31 uV_total_noise_RMS

    which matches the value you are getting from the "Total Noise" plot. So, the simulation is doing fine.

    I may have confused you by implying the Process, Averages, RMS value is the direct noise output over that bandwidth (which is not the case).  You still need to multiply the RMS value by the sqrt of the bandwidth. In fact I had not run through an example, like you have, to verify.


    To answer your question:

    "That is, any point on the "total noise" curve is calculated as the rms-summed of the "output noise" from DC to that frequency point (NOT CONFIRMED)"

    My answer: No! Here is the correct statement:

    That is, any point on the "total noise" curve is calculated as the rms-summed of the "output noise" from Analysis Start frequency to that frequency point.


    Here is what I wrote in my original response on 6/4/14:

    "TINA-TI "Total Noise" plot is RMS noise from the analysis start frequency up to the x-axis value (or if you use a cursor, the cursor frequency).  "Input Noise" and "Output Noise" plots are in V/RtHz (or A/RtHz if you have selected a current source as your input, or if you've designated a current value as your output, respectively)."

    Hope this resolves everything.


    Regards,

    Hooman

  • Hooman,

    Now I'm extremely close.  I've edited my post.  Please look at the edit version with red text and tell me if my  SNR is 0.9688 dB = 1.12 seems correct.  If so, then I *did* understand all along and the answer to my very first question is "Yes".  (Fourth paragraph of original post.)

    Thanks VERY, VERY much,

    Helmut

  • Hi Helmut,

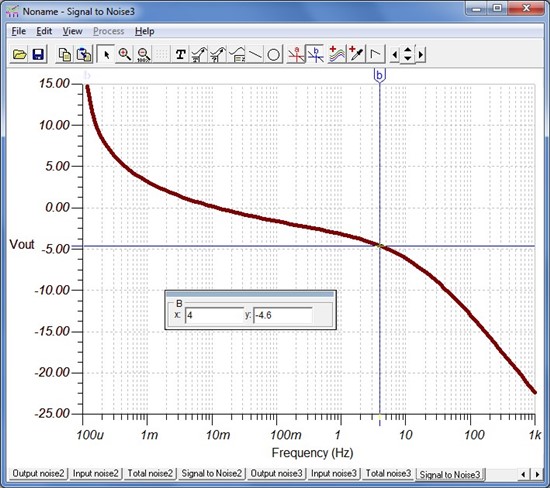
    When computing SNR over such a low LPF frequency (4.02Hz), keep in mind that you are in the 1/f noise region of the OPA637. Therefore, depending on the Noise Analysis start frequency (where you've used 1Hz), you'd get a different SNR result.

    Here is the SNR reading if you start at 0.1mHz instead of 1Hz (SNR= -4.6dB):

    If you were not dominated by 1/f noise (i.e. if your LPF cutoff was far above the 1/f noise corner of the OPA637), the Noise Analysis start frequency would not have affected things as they are now!

    So, to get the actual SNR in your special low frequency application, you must consider the lowest frequency that matters in your application. If this is a sampled system, the lowest frequency is somehow related to the sample and hold time of your ADC (although I'm not well versed on that- you may be able to Google it). If it is an analog only system, may be a good measure of the lowest frequency is how long you are willing to wait (seconds) for a measurement.

    Regards,

    Hooman

  • Hooman,

      Ok, you still haven't explicitly answered my question, but your second paragraph resulting in -4.6 dB implies it sufficiently that I'll quit asking.

    I ran my noise analysis from 100uHz and got the same -4.6 dB.  The lesson here is that I went from +0.9688 dB to -4.6 dB, from passing to failing specs, by observing closer.  I was indeed worried about the 1Hz start.  

    I ran again from 100nHz and got -6.34dB.  From 100pHz and got -7.58dB.  So it still seems to be settling in. 100fHz gave me -8.54dB.  Of course, 100fHz is a period of 31.7 MILLION YEARS.

    I would think this thing would asymptotically approach a stable value, the true result.  Is it possible that the models are flawed at the very low frequency?  This will make my analysis job very tough.

    ABOUT DOWNSTREAM...

    I am using an ADC and I understand it very well.  I'll be using oversampling.  Waiting to sample isn' t how you do it.  You oversample and get a noise reduction of a factor equal to the square root of your oversampling.  So if I oversample 240 times, noise should be reduced by a factor of 15.5.  However, because the output has a DC offset, I must in fact sample both the top and bottom of the square wave, subtracting.  I'm pretty sure that subtraction means I must add two noises together.  So instead of 1/15.5 as much noise I get 2/15.5 as much.  Rephrase that as a reduction by a factor of 7.75.  

    I haven't tried this before, but for SNR=20log(S/N) I now have SNR=20log(S/N/7.75).  I think that's SNR= 20log(7.75) + 20log(S/N).  This means the oversampling will help me add 20log(7.75)=17.8dB to the SNR of the input to the ADC.  So if that input were still at -4.6dB, adding +17.8 to it yields +13.2dB.  In other words, the oversampling got me passing spec again.

    MEANWHILE...

    I need to re-assess my "S/N Signal Amplitude".  My output signal is 100nV peak-to-peak.  I suspect the "S/N Signal Amplitude" is supposed to rms, not p-p.  I've found conflicting advice online about how to combine those.  Because my ADC later effectively removes the DC component, I am thinking that the rms value is half the peak-to-peak for the square wave.  This means my signal should have been 50nV rms provided as "S/N Signal Amplitude".  Of course, playing with log math, that will subtract 6dB from my prior result.  This makes the -4.6dB become -10.6dB.  But the ADC still saves the day, adding 17.8dB to get +7.2dB.  Gotta love oversampling.

    QUESTION: Does the 50n sound like the right value to give "S/N Signal Amplitude" when I have a 100nV p-p output signal?

    Have a nice weekend.

    -Helmut

  • Hi Helmut,

    You have impressive knowledge on signal processing. I'm no match (so I don't think I can help you much there. Sorry).

    I've posted our conversation on the Data Acquisition forum in case anybody there has comments that would help:

    http://e2e.ti.com/support/data_converters/precision_data_converters/f/73/t/348202.aspx

    For SNR computation purposes, I'd use 0.707 of the 100nVpp as your signal amplitude (assuming a sinusoidal waveform, although I know you are dealing with a square wave) or 71nV_RMS signal. My thinking is that the square wave higher harmonics will probably be filtered by your LPF anyway and leave you with only the fundamental. I could be wrong though.

    Regards,

    Hooman

  • Hooman,

    Nope, I have to keep the wave square enough that the oversampling by the ADC sees the same value at the bottom as well as top of the square wave, as opposed to seeing a triangle-like sawtooth.  I'll adjust caps to make sure I'm not rounded.  I can look at variation (even std deviation) of ADC samples to see if there's too much fall or rise on those bottoms and tops, respectively.

    I'll stick with 0.5 of the 100nVp-p, or 50nV. 

    NOTE: I did it all on paper first, and found that the feedback resistor was the A NUMBER ONE noise source out of everything.  Nothing else really had much of an impact.  This included using a NON-IDEAL opamp with Id, In, Vos and En terms.  This simulation show reasonable consistency with the paper calculations.  The paper calculations said the output noise would be around 40.7nV, due mostly to the 100k resistor's [Johnson noise]. Meanwhile, the simulated output, prior to RC filter that actually adds noise at these levels, appears to be falling torward that same value.  CONSISTENCY.  It's in fact 44.2nV at 10Hz as it falls toward 40.7nV at higher frequencies.  For LOWER frequencies, however, the paper calculations remain flat at 40.7nV while the simulation rises.  Yes, a 1/f rise.  So maybe my paper doesn't include the 1/f noise of the opamp.  I'll go back next and check that.  If I can get the paper and simulations matching at lower frequencies, it adds greater confidence.  This can also relieve problems of moving the start frequency lower and lower not stabilizing for the simulation.

    Thanks for all your help.

    -Helmut

  • Hooman Hashemi said:

    VSig is a user-defined value that you enter in the Noise Analysis dialog. The default value is 1V.

    ... and you chose "1V" for your S/N analysis

    It does not say "V" anywhere in the configuration window, can that be added?  If the "Signal Amplitude" chosen is too large, does it clip?

  • Hooman Hashemi said:

    Another measure of noise, the “signal to noise ratio,” takes the signal magnitude into account. This is the ratio of signal power to noise power, ...  VSig represents the expected signal amplitude. VSig is a user-defined value that you enter in the Noise Analysis dialog.

    Ohhhhh.  So the "Signal to Noise" measurement has nothing to do with the actual gain of the circuit?  It's just the same information as the "Total Noise" plot, but displayed in dB below some arbitrary level rather than displayed in volts?  That's not what I expected at all.  That would explain why the "SNR" changes by 2 dB when the gain and noise both drop by 2 dB, though.  I expected this to have no effect on "SNR". 

    Is it possible to add other plots to the Noise Analysis window?