This technical article was updated on July 23, 2020.
When evaluating an analog-to-digital converter (ADC), many designers use a fast Fourier transform (FFT) analysis to characterize the ADC’s dynamic performance. This dynamic test method consists of applying a pure, single-tone sinusoidal signal at the inputs of the ADC and performing frequency-domain analysis of the ADC data to quantify the noise and distortion components in the spectrum. When characterizing ADCs, coherent sampling can accurately resolve the spectral components in the FFT. In applications where it’s not possible to meet coherent sampling criteria, applying a window-weighting function to the sampled data will minimize spectral leakage.
In this post, I will talk about two of these critical concepts for FFT analysis of ADCs: the fundamentals of coherent sampling and the effects of noncoherent sampling when evaluating ADCs. In my blog series, I will cover the criteria to achieve coherent sampling, windowing sampling and optimal window selection.
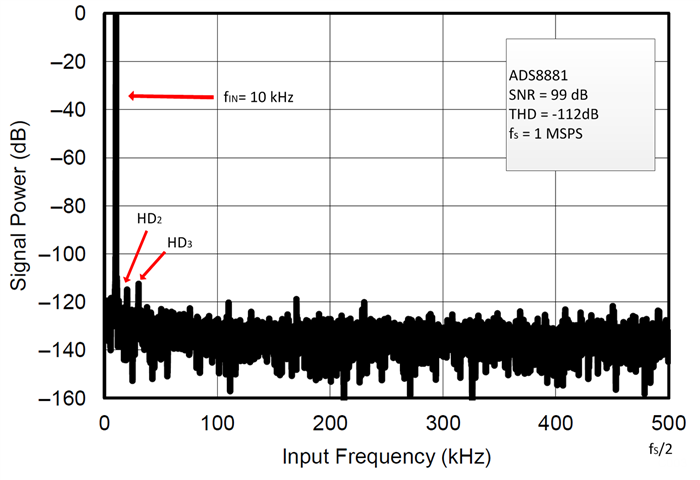
Figure 1: FFT spectrum of the ADS8881, an 18-bit, 1-MSPS, true differential input SAR ADC
The FFT is an efficient algorithm that performs the discrete Fourier transform (DFT) of the sampled time-domain signal. It requires a time-domain record with a number of samples, M, that is a power of two. The FFT spectrum consists of M/2 discrete-frequency bins with a range from DC to fS/2 and a frequency resolution of fS/M, where fS is the sampling frequency. Figure 1 shows an example of the FFT spectrum evaluating the ADS8881, a successive-approximation-register (SAR) ADC.
It is important to evaluate ADCs in conditions similar to their use in the end application. For example, ADCs measure AC or dynamic varying signals in several fields; these include applications in automated control, sensors, telecommunications, high-speed instrumentation, audio. When you look at the output spectrum of the FFT, it is easy to quantify the dynamic response of the ADC by measuring the magnitude of the various harmonics and noise components of the digitized signal. System engineers refer to different specifications to compare the dynamic performance of devices. For example, the signal-to-noise ratio (SNR) measures the amount of noise and spurious components that are introduced into the signal by the analog-to-digital conversion process. The SNR with respect to the carrier is calculated as the ratio of the power of the fundamental tone signal, to the power of the noise, in the spectrum (excluding DC and harmonics), as shown in Equation 1:
Similarly, total harmonic distortion (THD) is the ratio of harmonic power (typically the first nine harmonics) to fundamental signal power, as shown in Equation 2:
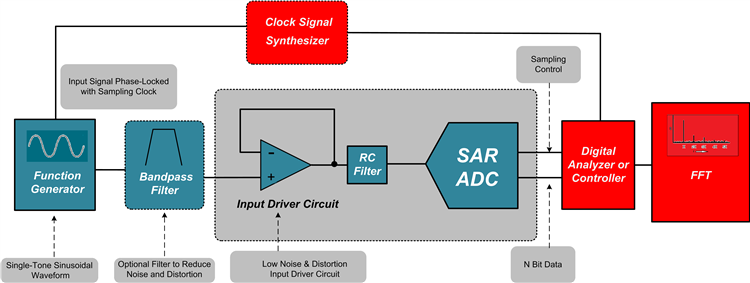
When evaluating precision ADCs on the bench, the test setup requires a low-distortion precision-signal source. To resolve very small noise and distortion components produced by the analog-to-digital conversion process, the sinusoidal input signal must have better spectral performance than the ADC under test by some margin. A good rule is to use a source that exceeds the ADC performance by at least ~10dB. In many cases, the spectral purity of the function generator is not sufficient and a high-order band-pass filter is required between the function generator and ADC to reduce the noise and distortion of the test signal, as shown in Figure 2.
Figure 2: Typical bench test setup for dynamic SAR ADC evaluation
In addition to the purity of the test signal, the input-signal frequency plays an important role in FFT analysis. There is a relationship between the input-signal frequency, the sampling frequency and the number of samples in the FFT. This brings us to the concept of coherent sampling.
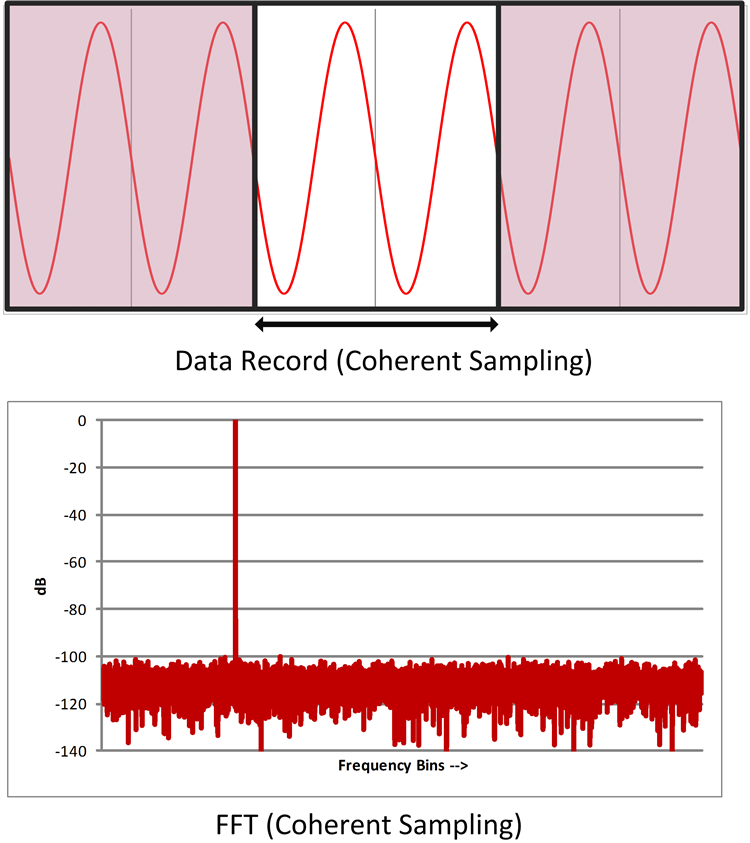
The continuous Fourier transform (CFT) integrates a signal from an infinite time interval. In contrast, the FFT is an approximation of the CFT and transforms a data record sampled during a limited time interval. Think of the FFT as a sampled version of the CFT, where an infinite sequence is formed by duplicating the sampled data an infinite number of times. This is shown in Figure 3, where the FFT assumes that the signal contained within the data record frame is repetitive.
Figure 3: Time record with integer number of sinusoidal cycles and FFT frequency spectrum
In Figure 3, an integer number of cycles of a sinusoidal wave is contained within the time-data record frame when using coherent sampling (top). Since no discontinuity occurs at the end points of the data record, the resulting FFT shows the proper frequency spectrum of the sinusoidal signal (bottom).
If the samples on the time record do not start and stop within the same value in the time-domain frame, the FFT interprets this as a discontinuity in the waveform. Let’s consider a case where the sampled data record contains a noninteger number of cycles (Figure 4).
Figure 4: A data record with a noninteger number of cycles produces spectral leakage in the frequency domain
Figure 4 shows the FFT of a sinusoidal signal with a noninteger number of cycles in the time record. The abrupt transition at the end points of the sampled record produces frequency components in the FFT that are not present in the original sinusoidal signal. The sinusoidal signal energy that should be contained within one frequency bin in the FFT smears across other bins. This spreading effect across other frequency bins in the FFT is known as spectral leakage.
Coherent sampling of a periodic waveform is achieved when an integer number of cycles of the periodic input signal is contained within the sampled data frame. When using coherent sampling, the resulting FFT displays only frequencies corresponding to the input and its harmonics.
In part 2 of this series, I will cover the criteria necessary to achieve coherent sampling on the bench.
References
Bores Signal Processing. “FFT Window Functions: Limits on FFT Analysis.”
Chioye, Luis. “Choose the Right FFT Window Function When Evaluating Precision ADCs.” Electronic Design, Nov. 12, 2013.
Data Acquisition Optimized for Lowest Distortion, Lowest Noise, 18 bit, 1Msps Reference Design


