This thread has been locked.

If you have a related question, please click the "Ask a related question" button in the top right corner. The newly created question will be automatically linked to this question.

CCSv6 doesn't hit the breakpoints

Hi all,

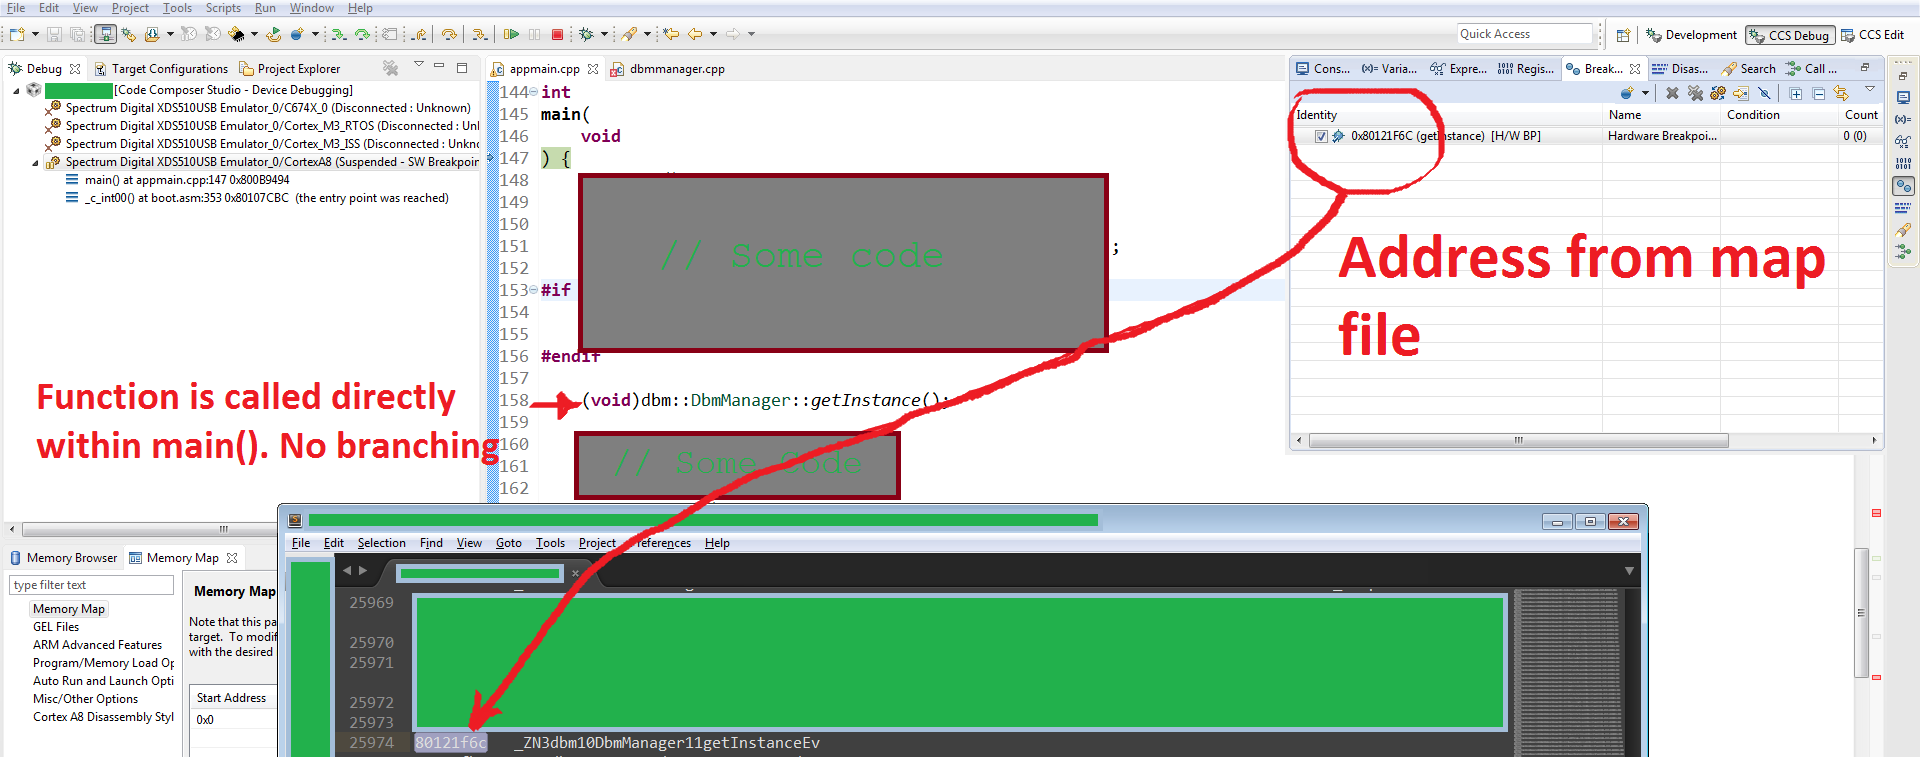
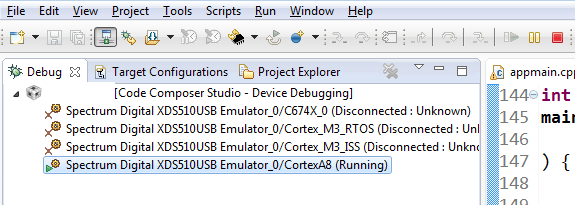
I am using CCSv6, and after I load the .out debug image, the breakpoints (SW or HW) never hit. I've placed the breakpoint by:

  • Double-click on the line number.
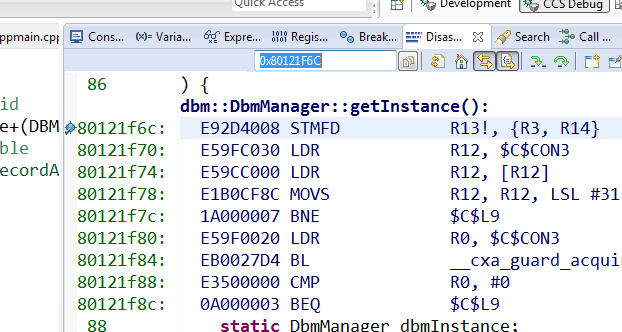
  • By Address from map file

Am I missing any ccs-specific configurations\settings ?

Thanks in advance.

  • Hello,
    There are many potential reasons for your issue. Without more details, it is hard to guess. A reproducible test case would help a lot. Even a screenshot of your environment showing the set breakpoints (and the breakpoints view) would help.

    Other useful details would be:
    -What is the full CCS version number?
    -What device are you using?
    -Are you setting the breakpoint in RAM or Flash?
    -Are you working with optimized code?

    Thanks
    ki
  • Hi Ki,

    Thanks for your reply.

    CCS version: 6.0.1.00040 (From Help->About)

    Device: DM814x SoC

    Breakpoints in RAM.

    Optimization is disabled. (Compiler Flags are -mv7A8 --abi=eabi -me -ms --gcc --preproc_with_compile --neon)

    Test Case:

    • Launch Debug Session.
    • Connect to Cortex ARM A8 core.
    • Load the .out debug image for A8. After a while CCS could locate the main() automatically.
    • Set some breakpoints using address from map file and\or from line number column in source.
    • RUN A8.

    Expected: Breakpoints hit.

    Observed: Breakpoints never hit.

    Screenshots:

    After running, the breakpoint is not met.

    This is a multi-core SoC, where there is a synchronization between the 4 cores using TI IPC package. However, the breakpoint shown in the screenshot should be executed before coming to the point in which A8 waits the other cores (which I didn't load images for).

    I also tried to load the images for the entire chip, and got the same result.

    Please let me know if I can provide any further details.

    Thanks in advance

  • Sorry for the delayed response.

    Looking at your screenshot, it looks like a hardware breakpoint was set and enabled at 0x80121F6C. Can you confirm that the program does indeed reach this location? Can you single step to it?

    Thanks
    ki
  • Hi Ki,

    Thanks for your response.

    I could step over every and each line before line 158, and when reaching line 158, I could also step into the implementation of getInstance() method, then I could step over the few lines after line 158.

  • Can you also open the the disassembly view and show the breakpoint set at the specified address?

    You also mentioned you are using the DM814x. Is this a custom target board or is this the EVM?

    Thanks
    ki
  • Hello Ki,

    Kindly find this screenshot, showing the breakpoint set in the assembly view.

    The used board is customer board.

  • Hello Ki,

    Any possible reason for this behavior ?