This thread has been locked.

If you have a related question, please click the "Ask a related question" button in the top right corner. The newly created question will be automatically linked to this question.

CCS/AM5728: MPU0 freeze in RTOS

Part Number: AM5728

Tool/software: Code Composer Studio

I have a problem with stability running TI AM5728 based custom board, similar to the Beaglebone X15. RTOS SW is running on one core MPU0 and sporadically (most often after several hours) freezes. When freezes it is impossible to connect to the MPU0 target by debugger, at the same time I can without any problems connect to the MPU1.

Debugger error: CortexA15_0: Trouble Halting Target CPU: (Error -1323 @ 0x1386AC) Device failed to enter debug/halt mode because pipeline is stalled. Power-cycle the board. If error persists, confirm configuration and/or try more reliable JTAG settings (e.g. lower TCLK). (Emulation package 6.0.504.1)

For test purposes, I have started the simple program on the MPU1, and when MPU0 freezes MPU1 continue normal operation. WFE and WFI flag for MPU0 is inactive, moreover, I have made the additional test with trying to put MPU1 to the WFI/FORCED_OFF state. However, I still can connect with debugger and wakeup it from the FORCED_OFF state, as described in the technical manual.

I have dumped the registers by connection to the CS_DAP_DebugSS and have not found anything special. Register dump attached:

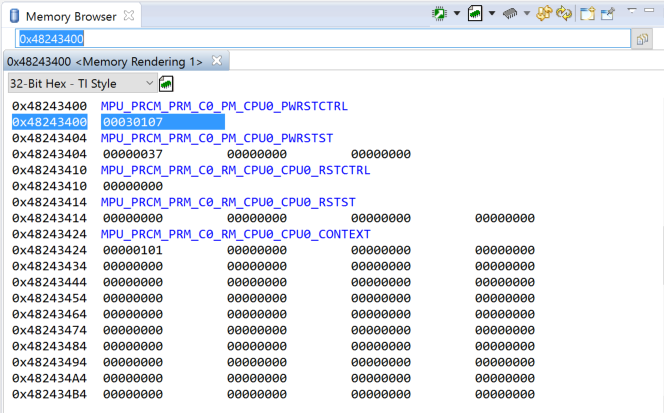
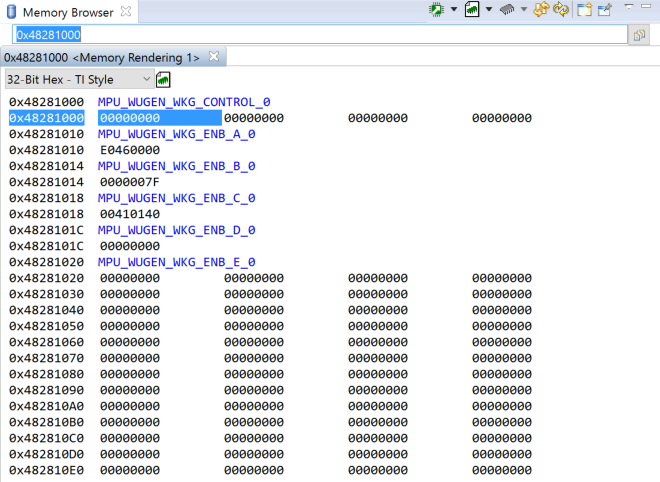
What can be the potential cause of freezing problem just one core without a possibility of connection with debugger and second core running without problems?

  • The RTOS team have been notified. They will respond here.
  • It is unclear whether the reason for the core to freeze is caused due to RTOS SW or due to device or board settings.

    I am going to loop in a hardware expert for additional insight to help with this issue. Can you confirm that you have update your pinmux settings using pinmux tools for the custom board and configured the IO delay for the interfaces as described here:
    www.ti.com/.../sprac44a.pdf

    Are you configuring AVS and ABB setting using the PMIC as has been shown in the SBL code we provide in the RTOS SDK. does the same application run on the Beaglebone X15 without any issues? Can you indicate what code was MPU0 running (code runs from DDR? , what interfaces are exercised, etc)

    Regards,
    Rahul

  • I will check the IO delay configuration later.

    We are configuring AVS and ABB using function from the pdk 1.0.5 and configuring
    PMHAL_VM_OPP_HIGH and BOARD_INIT_PLL_OPP_HIGH

    I can't start the same application on the Beaglebone X15, because it is HW depended.
    Code on MPU0 is running from the DDR memory and utilize a lot of peripheral: UART, I2C, EMMC, Ethernet, GPMC, Timers, CAN, EMIF

    Additionally we are using one DSP and one PRU core.
  • Romko,

    There can be either board design issues or software issues that can cause a core to disconnect from the debugger and then refuse to re-connect.  This problem space needs to be segmented.  Here are a few options:

    1. Was the application previously running robustly and then additional features or functions were added later coincident with the fault reported?  If so, you should revert to the program before and then add the new code in steps to see where the fault is added.
    2. Similar to #1, you can cut the application down down to a simpler program the runs without failing and then add functions incrementally until the issue comes back.  Then you can focus on the last change to identify cause.
    3. Similar to the above, you can cut the program down to one that can run on the GP EVM.  If it runs on the EVM but stalls on the custom board, you can then analyze differences between the boards that could be contributing.  You can emulate peripheral input streams to allow more code to run on the EVM without attaching physical interfaces. 

    Tom

  • Hi Tom,

    I understand that it can be either HW or SW issue, either even both. But the questions is, which SW error can lead to the state that I can't connect to the CPU core with a debugger?

  • Romko,

    Any software error that causes the code execution to branch unexpectedly, like a corrupted pointer, can cause this to occur.  The debugger cannot easily gain control of the core if it is executing a very tight loop.

    Tom

  • What do you mean by tight loop?

    Is it infinite loop like following: 

    @
    @ Go to infinite loop
    @
    loop1:
            B       loop1

    Or it could be some others commands? 

  • Romko,

    Right, something like that where the instruction fits into the instruction cache resulting in no external fetches out from the core.  This can often occur simply by executing random data.  To test the theory, load memory with random data and set the PC to the beginning and hit run.  Some data sets will result in the debugger not being able to connect.

    Tom