This thread has been locked.

If you have a related question, please click the "Ask a related question" button in the top right corner. The newly created question will be automatically linked to this question.

PCM4202: The curve of THD+N vs signal level

Part Number: PCM4202
Other Parts Discussed in Thread: PCM4204

Hi Sirs,

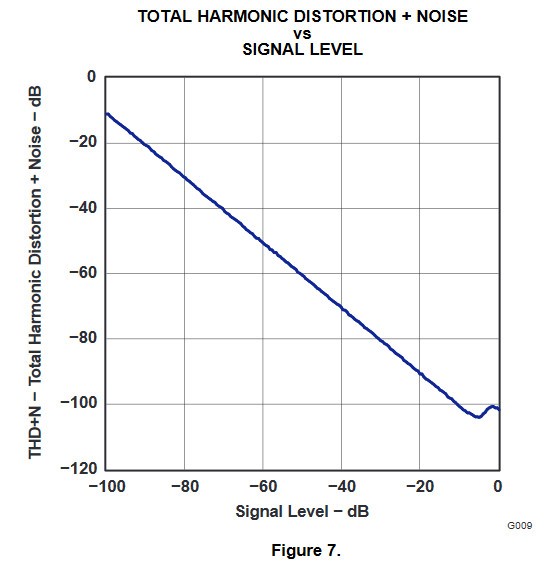
My customer ask there have the curve of THD+N vs signal level? They only found the curve of THD+N vs amplitude on the PCM4202 datasheet.

example: PCM1804 datasheet

  • Hello Henry,

    I will ask someone with more detailed knowledge on this device and get back to you by tomorrow.

    Best Wishes,

    Carson

    Low Power Audio Applications

  • Hello Again,

    If you took the chart in PCM4204 and at each point add the absolute value of the amplitude dB to THD+N dB you would then have the same type of chart as pictured above.

    Best Regards,

    Carson

  • Hi Sir,

    Does it mean THD+N @-20dB & -60dB will be the -111.5 & ~ -111dB ?

  • THD+N db= 20*log( Vnoise/Vsignal).

    The Device under test is given a standard input for example a 1 Khz Test signal. The device adds non linearity and creates harmonics to the 1k. In addition noise, Emi etc create additional noise at the output. A notch filter is placed at the output of the test setup to remove the 1k and the residue left is Vnoise.

    THD +n db=20*log(Vnoise)-20*Log(Vsignal)

    THD db= Vnoise db- Vsignal db.------eqn 1

    The Graph in PCM 1804 Datasheet is showing THD as a Ratio as is the case in formula.

    The graph in PCM4204 shows THD as a voltage. In other words it is just showing Vnoise, wrt Signal Input

    Therefore if we need to derive the graph of PCM 1804 from PCM4204, we just apply equation 1 

                           thd(ratio)=Vnoise db-Vsignal db  

    Corner values are                  -104 - 0 db                 -104db

                                                    -116-(-140)                24db