This thread has been locked.

If you have a related question, please click the "Ask a related question" button in the top right corner. The newly created question will be automatically linked to this question.

TPA2011D1: Nonlinear test result

Part Number: TPA2011D1

Hi,

please check customer question below. Thanks.

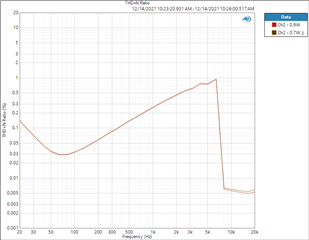
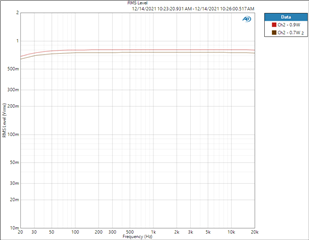
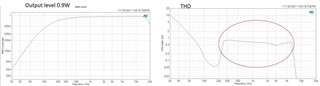
When output is 0.9W, looks like result is nonlinear, is that correct?

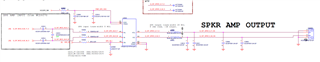
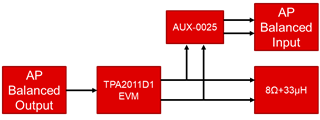
AMP 4.2V,dummy load 8ohm.
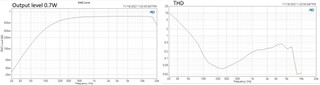
0.7W:


0.9W:


  • Hi,

    Is there a schematic you can share? Are you using an EVM board?
    Also can you share some captures of the output in time domain at specific frequencies in and out of that range of frequencies?

    As you may noticed already, the frequency response should be as in Figure 12 from data sheet: https://www.ti.com/lit/ds/symlink/tpa2011d1.pdf#page%20=9

    Best regards,
    -Ivan Salazar
    Applications Engineer

  • Hi Ivan, 

    It isn't EVM board.

    This  is a open loop test in system. I don't know how to capture the time domain.

    I attached the schematic for your reference.

    Thank you!

    Jean Wang

  • Hi Jean,

    I'll take a look at the schematic.
    In the meantime, could you comment if there is any other filter in the test setup? or only using the ferrite beads + capacitor?
    Class-D amplifiers should be tested using a low-pass filter like AUX-0025 from Audio Precision.

    Best regards,
    -Ivan Salazar
    Applications Engineer

  • HI Ivan,

    I used the low-pass filter "AUX-0025" from Audio Precision, and I also used the SW filter in Audio Precision which is sitting as below,

    Thank you!

  • Hi Jean,

    Thanks for the additional information, I'll double check this with a similar setup on my side. I'll share the test results with you by the end of the week.

    I would try to isolate the amplifier from other components by removing the filter at the output and only using AUX-0025.

    Best regards,
    -Ivan Salazar
    Applications Engineer

  • Hi Jean,

    I did the test on my side, please see the details below:

    • Test setup is as below:
    • Test results:

    Could you please try by manually setting AP output to EVM for higher frequencies instead of running the sweep? What is the waveform looking on the monitor?

    Best regards,
    -Ivan Salazar
    Applications Engineer

  • The is no abnormality with the waveform. 

    we usually using the stepped frequency sweep or continuous sweep to test, which model can I use manually?

    thanks! 

  • Hello,

    Right now our experts are out of office until Dec. 28th due to Holidays. We will get back to your question as soon as possible when we resume operations.

    Happy Holidays

    Carson

    LPA Applications Engineer

  • Hi Jean,

    I asked to manually set just to double check if the waveform was distorted or something similar. I also used stepped frequency sweep for my results above:

    Test results:

    In order to keep debugging, can you try with the other channel on the AP?
    Also can you try by setting Weighting to None? I used None and actually I don't see "Signal Path" option on my side.
    If you read THD+N for a specific frequency like you did above with scope, I assume this is below 0.5% correct? (as opposed to sweep plot)

    Best regards,
    -Ivan Salazar
    Applications Engineer

  • Thanks Ivan for help.

    I used another channel to test the AMP.

    The video recorded condition is same as the picture.

  • Hi Jean,

    Thanks for adding more tests. I think this latest plot is better than the first:

    Initially it was like this:

    0.9W:


    It seems now it is like this

    I used another channel to test the AMP.

    The video recorded condition is same as the picture.

    I think the results are now closer to the expected from data sheet spec.

    Let me know if you have any further questions.

    Best regards,
    -Ivan Salazar
    Applications Engineer