

Other Parts Discussed in Thread: TAS2770
Dear Sirs,
May I have your suggestion that how to measure the SNR, THD+N, Dynamis range with our EVM?
Thanks.

This thread has been locked.
If you have a related question, please click the "Ask a related question" button in the top right corner. The newly created question will be automatically linked to this question.
Hello, These measurements are fairly standard and common to any EVM. I always use Audio Precision(AP) to send the digital input and clocks and do the measurement.
I put the general description and procedure for AP here, if you are not using AP , you can use it as a guide to do your own measurements:
For THD you need 3 things:
1-Digital generator to create pulses
2-Analog analyzer to measure the analog signal generated at the output of DAC or LP filter
3- sweep window to do the sweep.
THD vs Power
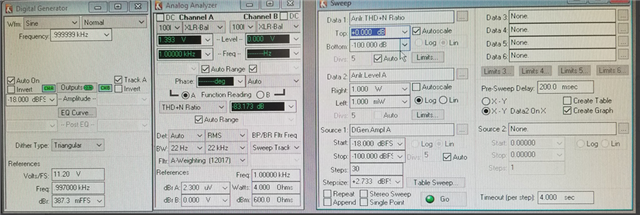
THD vs Power
In Sweep window Data1 and data2 are the values that will be plotted on Y-axis on left and right vs parameters that is being swept by Source 1 (on X-axis), which in this case it is the Digital Generator Amplitude. Note that in order to avoid OCP event, we start the sweep from -18DBFS to -100dBFS .
Also note “X-Y Data2 on X” is being selected which means it will plot data1 on Y axis and Data 2 on X axis . It is similar to the traditional plot from any simulation.
When it sweeps the power, for a given power on the x-axis, it adjust the amplitude according to boundary that is given in Source 1 to get the target power, then in measures THD+N for the obtained power. Then moves to the next power, adjust the power by changing the amplitude within the given range, then calculates THD+N for this power and keeps going on until the last point on power axis.
While the sweep is going on, you can monitor the amplitude in Dig Gen. and you see it is sweeping according to the range you put in Siurce1 .
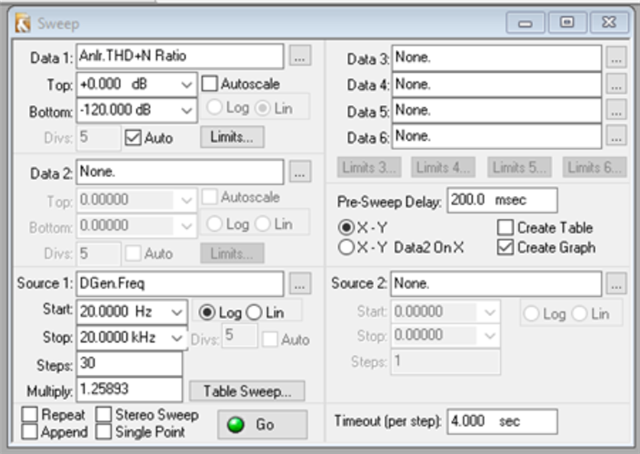
THD vs freq,
If we want to plot THD vs Freq, simply select X-Y and for Data 2 select “None” . For Source1 select DGen freq and set start and stop freq. The plot will be TDH vs freq. for the given amplitude that you have in Digital generator.
Dynamic Range using FFT
Dynamic Range is an expression of the ratio of the largest signal a device can pass to the device’s noise floor. “Largest signal” usually refers to a signal at a specified degree of distortion, often 1%.
Signal-to-Noise Ratio and Dynamic Range are essentially the same measurement, except that the signal in SNR is arbitrary and should be stated in the results, and the signal in Dynamic Range is at the maximum.
How do you define what the loudest signal is that a device can reproduce? Then, when you measure the noise level, over what bandwidth do you measure and do you apply any weighting filters?
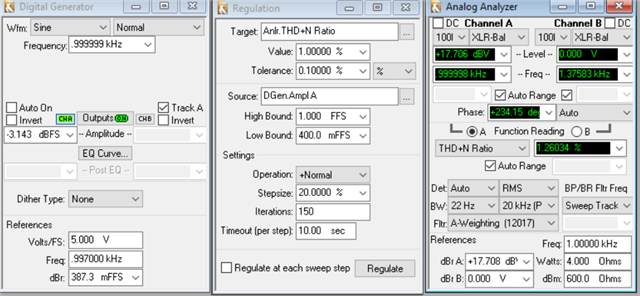
The AES17 standard specifies the maximum output amplitude of a device as its highest undistorted output and defines an undistorted output as one with less than 1% THD+N.
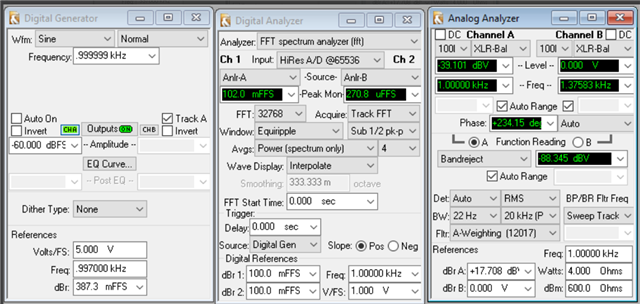
For noise level, the AES17 standard specifies that the device be measured with a sinusoidal signal at 997Hz with amplitude 60dB below the maximum signal amplitude. This is in order to ensure that the channel is not muted and the noise is measured in the presence of a signal. The tone itself is removed by using a band reject filter. This is what we usually refer to 60dB method in data sheets.
To do this test, we regulate the THD to 1% as shown in the set up here. Note the amplitude needed to yield this THD is -3.31 dBFS
In order to calculate dynamic range we need to get into FFT function. For doing this
SNR measurement in essence is very similar to DR measurements with one defining characteristics: in dynamic range, the ratio of the strongest to the weakest signal is measured where as for (SNR), the ratio of a given signal to the noise in the system is measured.
Regards,
Arash
