This thread has been locked.

If you have a related question, please click the "Ask a related question" button in the top right corner. The newly created question will be automatically linked to this question.

PCM5102A: PCM5102A problem

Part Number: PCM5102A
Other Parts Discussed in Thread: DRV632

Hi Dear,

Our customer have encountered some problems in the process of using PCM5102A. Please help us solve them.

1. The THD+N Ratio index is required to be 0.004% (88dB), but the measured data is 0.11%, as shown in the table.

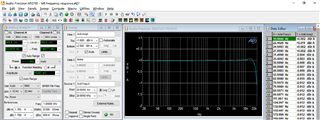
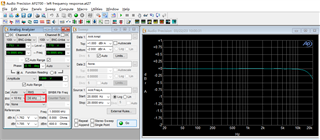
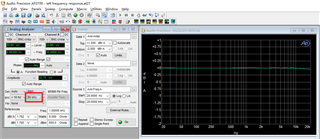
2.The frequency response from 18KHz to 20KHz drops a lot. Specific test data and pictures such as documents.

音频.xls

3.The following table shows the distortion indicators of PCM5102A. The maximum deviation of this chip has exceeded the requirements, but the measured results are much worse than the maximum deviation in the specification.

4. The customer has made some improvements in hardware, such as modifying the power supply; Increase the power filter capacitance; Cutting line; Reduce ESD devices; There is no obvious improvement after replacing the signal filter capacitor

5. Help to see if the audio signal amplitude used in the test is too large; Is there a problem with the setting of the test instrument?

6.The schematic diagram and layout are as follows.

RK3568_DMX_BOX _ 70.pdfPCM5102A PCB截图.docx

  • Hello Anna,

    we need to collect more data for finding the issue. 

    A piece of information we need is the screen shot of the I2S signals and the analog output,  which I assume would show a distorted signal at the output.

    Also, they can do a fft on the output to see what kind of harmonics are introduced on top of the fundamental frequency (for example a 1KHz input signa).

    We can also check the schematics to make sure there is no obvious issue.

    Please send the above data points and we go from there.

    Regards,

    Arash

  • Hi Dear,

    This is the schematic diagram

    2526.RK3568_DMX_BOX _ 70.pdf

  • Hi Anna, I checked the DAC section of schematic  . What i am not clear  is why they are connecting the output of the DAC to the output of the driver (DRV632) I would expect the output of the DAC to be connected to the input of the driver.   Am I missing something here?

    Can they disconnect the DACs output  from the driver and check the DAC stand alone without any connection?

    Regards,

    Arash

  • Hi Dear,

    1.As shown in the figure, DRV632 and peripheral related devices are not welded.

    2.Can you help me check again? Is there any way to improve the distortion?

    3.Can the THD+N Ratio index of PCM5102A reach 88dB?

  • Hi Anna,

    This part can provide 88dB THD.

    Please ask them to connect only the DAC (nothing to the output of the dac)  and see the result. Also please share a clear screen shot of the I2S signals and the output waveform. As a sanity check, their supply voltage is correct too?

    Thanks and regards,

    Arash

  • Hi Dear,

    Waveform is shown in the figure

  • Hi Anna , to be organized and avoid going back and forth please ask them to answer the following.  For  AVDD = CPVDD = DVD = 3.3V, fs = 48 kHz, system clock = 512 fs and 24-bit I2S format with input of 1KHz

    1-Disconnect the DAC from any load and measure THD and compare it to the THD=0.11% (60-dB) they were getting at the beginning. 

    2- What would be the effect if they change the input ( -1dB to -10dB and -20dB) with same 1KHz frequency

    3- Although I don't see a clear distortion in the Vout, What is the actual  freq they are using for SCK, BCLK and LRCLK? . Please send me clear screen shots of I2S signals (SCK, BCLK, LRCLK and DIN) . Avoid sending un-identified signals, I don't know what is the red signals that they included with Output waveform. 

    I need to see the edges and see the frequencies. Also I want to be able to see if format is I2S or LJ. They can give me multiple screen shot with different zooms  for I2S signals

    4- Did they get FFT of the output to see the tones?


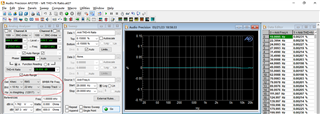
    I included  screen captures of AP2700 setup for my DAC in which I swept the input level and plotted the THD . Also in that you can read the THD value for the 1.25KHZ input at -10dB. Note I am using A_WT filter in the AP which helps a lot . In the other screen shot  a 1KHz,  -1dB sinewave was sent and THD is observed.  I don't see such screen capture in their report. Can you point me to a similar screenshot that shows the 0.11% THD in case I am missing it?


    Regards,

    Arash

  • Hi, Arash, I'm sorry for the late response.

    I have tried to modify the power supply circuit of the PCM5102A to make it as clean as possible, without any effect.
    I have tried A-WT in the AP2700 without much change.When I was playing this audio file, I saw FFT in the AP2700, and THD was very good!  But the amplitude of the audio signal doesn't seem no really, it's too low, only about - 70 dB.

    I suspect there is a problem with the audio file, but I cannot confirm it.

    1. This is a 0dB audio file;

    2. Different Codecs use this audio file exhibit consistency.

    3. The hardware has removed all filter capacitors from the signal, and the frequency response of the high-frequency part is still poor.

    Thank you very much for your help! 

    Regards,

    Celia Cao

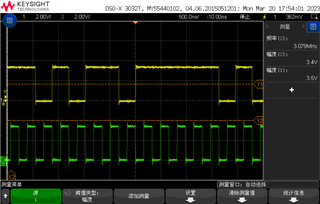
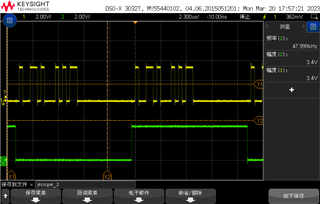
    1. SCLK & DATA   2. LRCLK & DATA     3. MCLK & DATA

  • Hello Celia,

    Can you confirm the clks and data format all in one plot. Usually either Power lines or the clks are the culprits. Clocks  individually look ok here but I want to see them all in one window and see the format (please refer to fig.14 in data sheet)  . Can you send me these plots with both LRCLK cycles in the frame as well as the zoom in of it so I can check the data format as well. 

    You mentioned you removed all filter caps , just want to make sure you disconnected the DAC and measure the THD at output of the DAC. Please send me the screen shot of spot reading of the THD with  -1dBFS at the input ( similar to the fist screenshot I sent you from AP readings)

    Regards,

    Arash

  • Hi, Arash,

    Please let me share a good news with you, THD+D has reached a perfect 0.0045%! I think a small signal level is the reason for reaching the standard. I found a - 1dB 48K audio file.

    At the same time, I checked the I2S signal and found that it conforms to the I2S data format, consistent with Figure 14. Because I only have a dual channel oscilloscope, I tested LRCLK and SCLK with one probe, and DATA with the other probe.

    In addition, the frequency response of the high-frequency part is still unqualified. We hope that the frequency response is -0.5dB at 20KHz. I removed the 2.2nF capacitance from the output terminal, without any change. I'm not sure who caused this problem, audio files or Pin FLT?

    Thans for your help!

    Regards,

    Celia Cao

  • Hello Celia,  

    I am curious about the SCk  and why it is shifted like that. 

    from your plot you have -1dB at 20KHz,  I am not clear why you are targeting -0.5dB, but you can  adjust the LPF roll off by your filter design. 

    You can switch b/w the different  options on FLT and see if  it is what you are looking for. 

     Regards,

    Arash

  • Hi,Arash

    The waveform is the superposition of LRCLK and SCLK. I need to see three signals on a dual channel oscilloscope. Anyway, perhaps, we can confirm that they are OK?

    Frequency response seems to be a problem with AP setup. We modified the BW of the AP to 30K and 80K, and the test results were qualified. Your support has led me to find a solution. Thank you.

  • Excellent, glad you are getting what you wanted on the freq response. From your plots, the format is correct and adhere to I2S with one bit shift.

    Thanks,

    Arash