Tool/software:
Hi support Team,
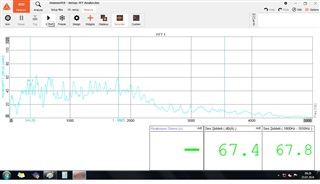
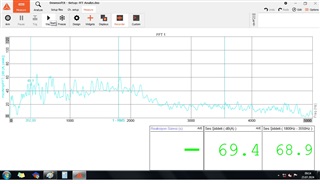
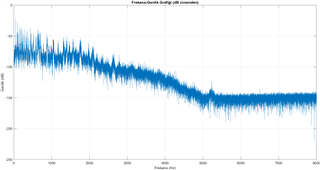
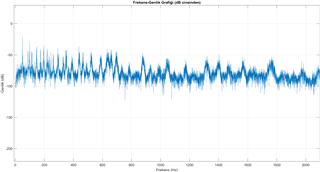
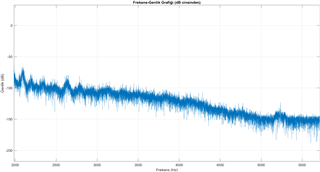
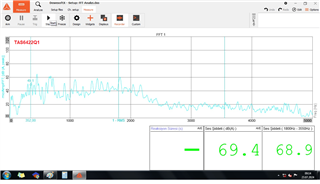
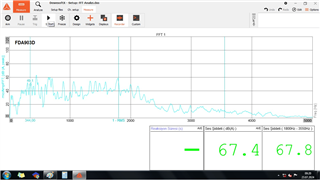
When we measure the FFT graph of the ECU, the frequency spectrum after 3000 Hz is not as expected. We are trying to identify the correct FFT graph by comparing the ECU used with another amplifier (FDA903D) under the same environment and conditions. The WAV file being played is the same: 16-bit, 44.1k sample rate. The only difference between the ECUs is the amplifier units. The TAS amplifier's configuration settings are all at their default settings, and when I checked all the register fields, I did not see any settings related to this issue. There is a High Pass Filter and corner frequency setting, but since they are 4, 8, 15 Hz, I considered them irrelevant.
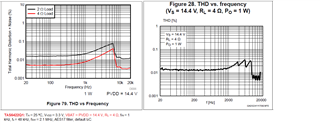
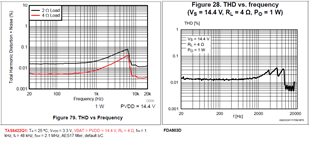
We compared the Frequency THD vs. frequency graphs of the two amplifiers. (RL=4 ohms for both ECUs.) I did not see any significant difference. In fact, the THD rate in the frequency band of the TAS amplifier looks better There were some differences in the THD vs. output power graphs. However, I increased the input voltage of the ECU with the TAS amplifier from 12V to 15V ( and so icreases the VDD pin of the amplifer) and did not see a significant difference in the FFT after 3000 Hz. There were some differences in certain frequency bands, but this is not the main cause.
The amplifier outputs of both ECUs are designed according to the filter circuits specified in their own datasheets or the Evaluation Boards. What is the main cause of this diffrence? Which point should I focus?