Tool/software:
Hi Ivan & All,
Firstly, there are more comprehensive documents available, but as this is related to a project which is under NDA, I can not share them here. But please contact me directly to my email address and I can share them.
I am working with electrical amplifier measurements of TAS2563QFN implementation. I am measuring frequency response, THD, from speaker driver + - pads and play the test signal from Device's Linux system with aplay -command. However I am able to repeat this same issue on EVM with USB connection to my Windows computer.
On a customer device we are working with, we experience high THD % in a strange way:
THD % Is around 2% if input signal is between -15dBFS - 0dBFS
THD % gradually increase up to almost 10% at some frequencies, when input signal gets smaller, below -15dBFS
THD % Suddenly vanishes at -27dBFS and drops below 1dB.
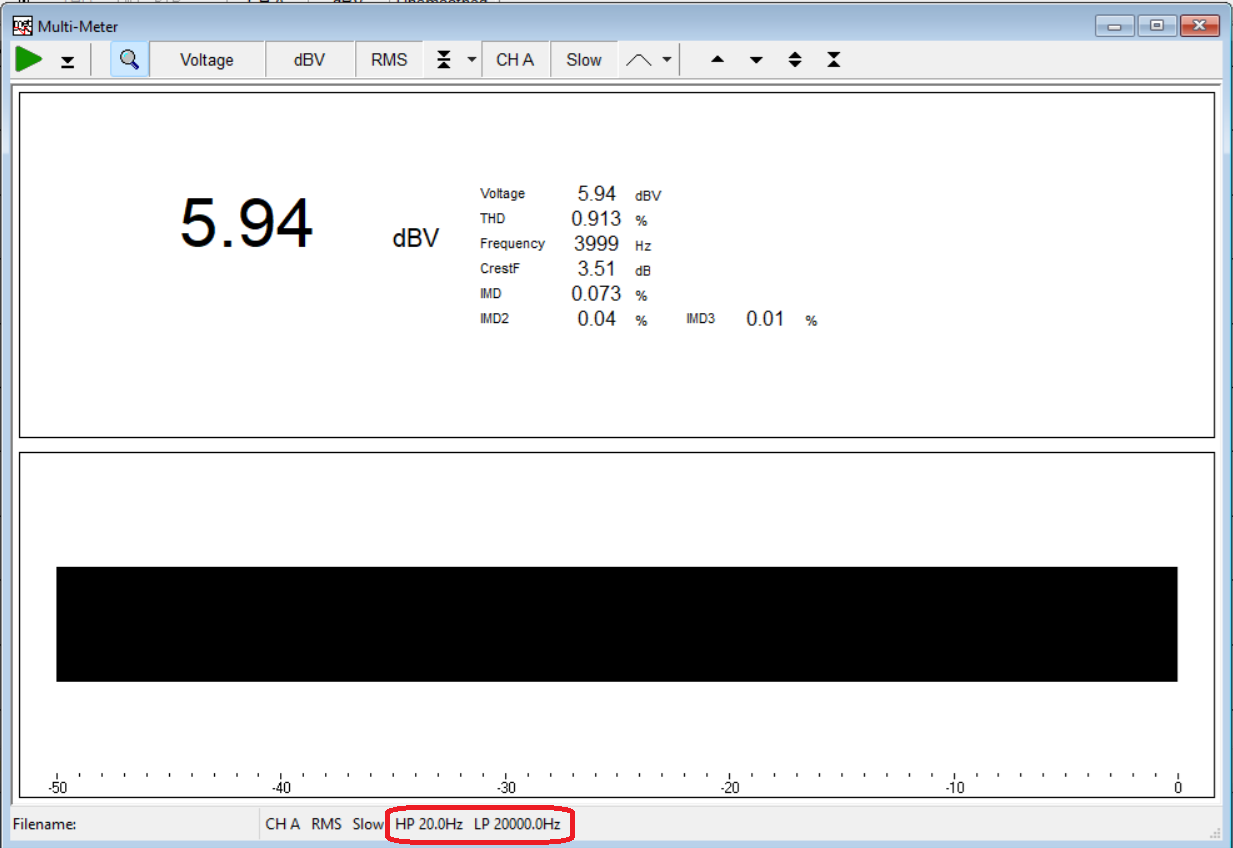
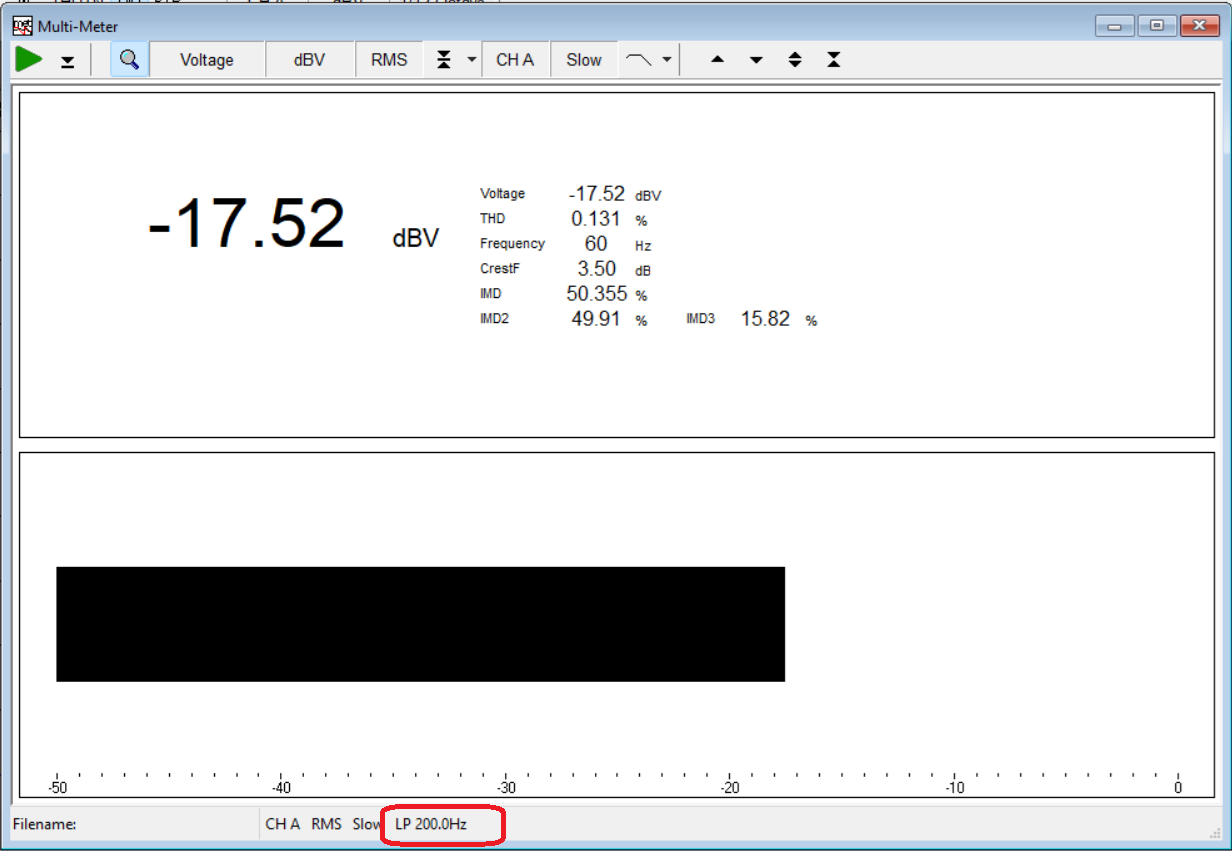
If I Inspect THD results in THD dBV, I can see that there is a constant-level disturbance of some kind, which suddenly appears when input signal reaches about -27dBFS. Because main signal is more silent, I can see higher THD % at lower levels.
My Test signal is sinusoidal sweep, essentially time synced sine sweep starting from 20kHz and going down to 10Hz over a time of 34 seconds.
If I use MLS noise instead, I can see very strange peak at 60Hz, despite my high-pass filter is at much higher frequency. Again, this peak vanishes when input signal is around -27dBFS.
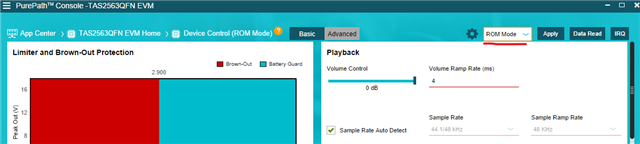
Like I did mention, I was able to repeat this issue with EVM board and 4 ohm resistor, using .ppc3 with nothing else configured than Smart Bass as according to required parameters of our speaker driver.
In Images below, I am introducing the measurement setup I use, also results from .ppc3 attached. External Lab Power was connected to Ground / VBAT and provided 5V 2A capacity.
I did this in a hurry, so input signal seems to clip around -8dBFS, so I do not show those results. Real setting to my device has been attenuated with same -8dB to avoid this clipping. Interestingly, this does not affect the corner point of -27dBFS in any way.
Legend is following:
Gray -9 dBFS
Green -12 dBFS
Yellow -15 dBFS
Orange -18 dBFS
Blue -21 dBFS
Purple -24 dBFS
Cyan -27 dBFS
Red -30 dBFS
SmartBass Only For TI.zip
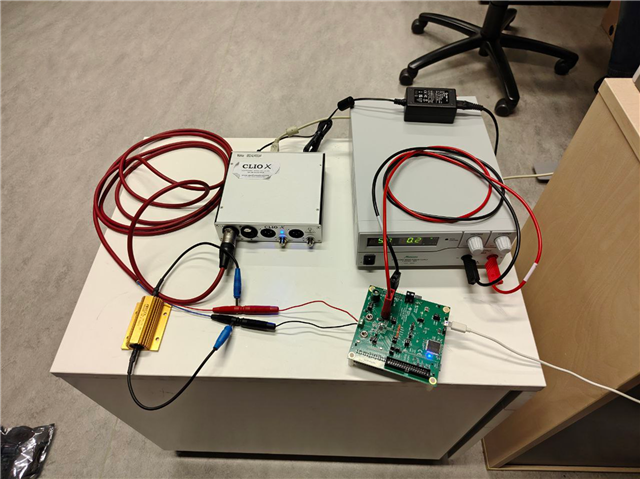
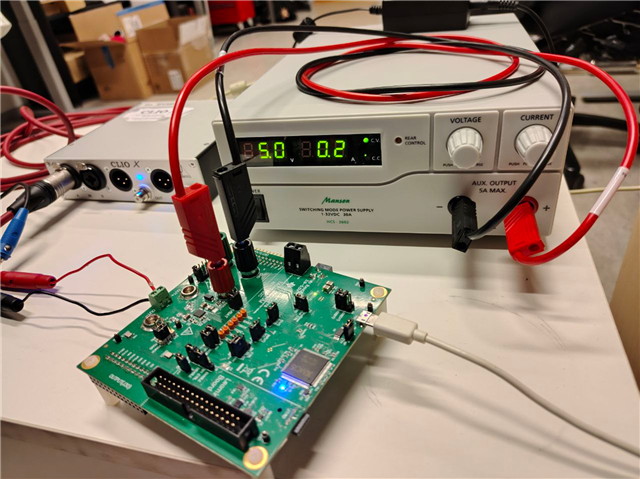

Image Above: Sinusoidal Sweep from -30dB FS to -9dBFS over 4 Ohm resistor. Frequency Response

Image Above: Sinusoidal Sweep from -30dB FS to -9dBFS over 4 Ohm resistor. THD %

Image Above: Sinusoidal Sweep from -30dB FS to -9dBFS over 4 Ohm resistor. THD dBV

Image Above: MLS Noise from -30dB FS to -9dBFS over 4 Ohm resistor. Frequency response