This thread has been locked.

If you have a related question, please click the "Ask a related question" button in the top right corner. The newly created question will be automatically linked to this question.

TPA3250: THD get low at high frequency

Part Number: TPA3250

Hi Team,

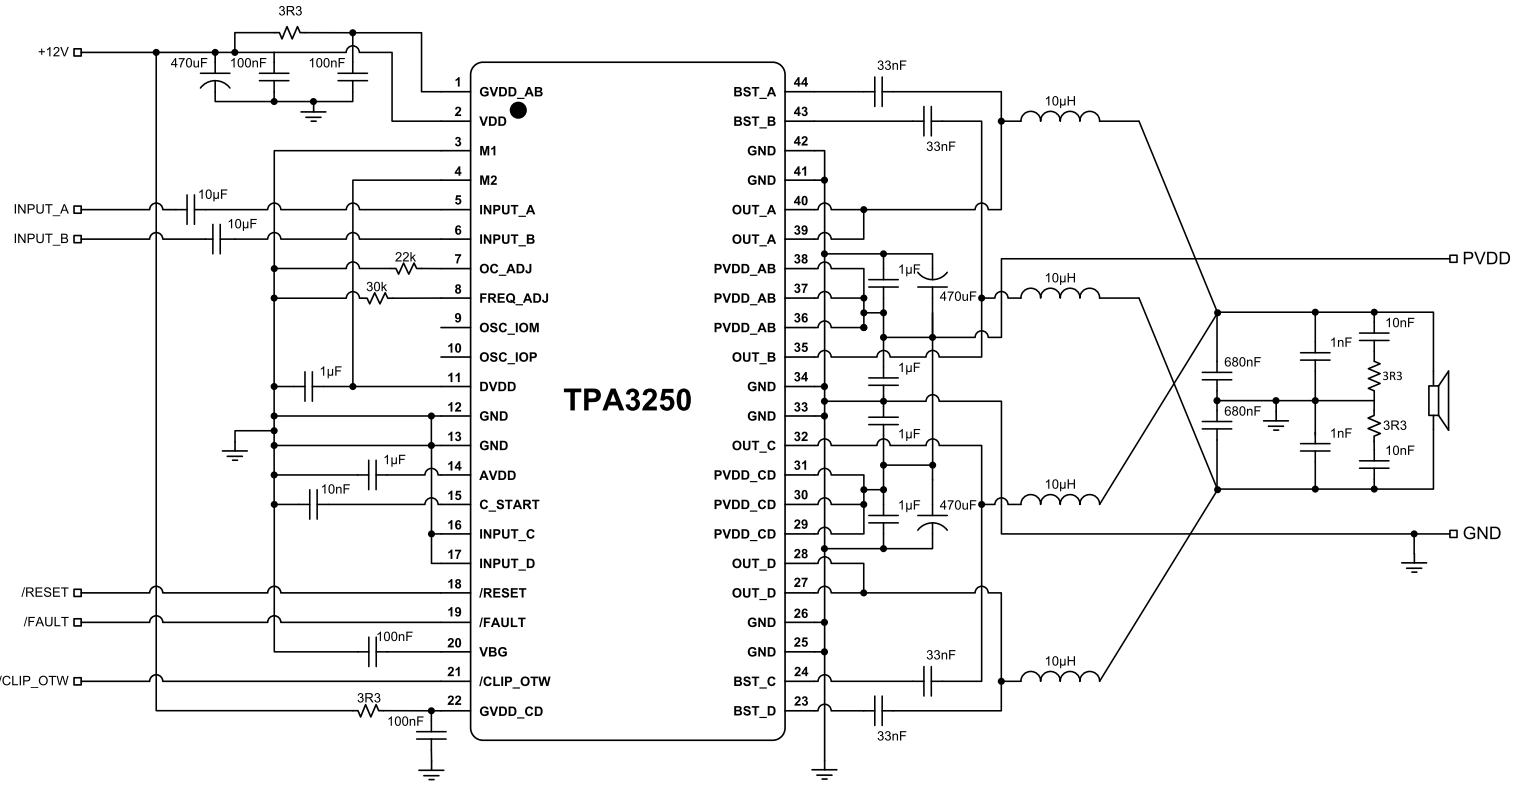
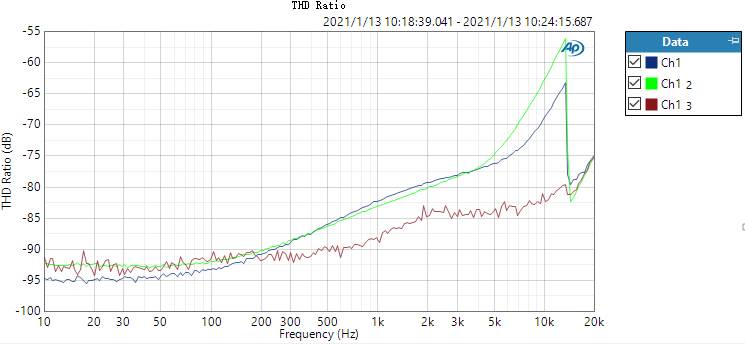
Customer use TPA3250, they get low THD at high frequency, below is their test result. And they use the same output filter as datasheet P26 show. Could you help check what the potential reason for this? Thanks.
Thanks, 

Will

  • Hi Will,

    I've got some follow up questions for you:

    - What is the impedance of the load you are using?

    - What AP filter are you using? Is it the same as what's used in the datasheet?

    - Please clarify what the blue, green, and red lines on the graph are representing.

    - What is the output power that you are using on this sweep? Are you regulating it throughout the sweep?

    The more information we have the better we can determine what's happening.

    Best Regards,

    Robert Clifton

  • Hi Robert,

    Thank you for answering the question. Here's the answer for your question:

    - What is the impedance of the load you are using?

    re:The impedance of the load is 8R.

    - What AP filter are you using? Is it the same as what's used in the datasheet?

    re: The AP filter is AUX-0100, the Audio Analyzer is APx525.

    - Please clarify what the blue, green, and red lines on the graph are representing.

    - What is the output power that you are using on this sweep? Are you regulating it throughout the sweep?

    re: The blue line represents the output power is 5.78W.

    The green line represents the output power is 18.3W.

    The blue line represents the output power is 0.125W.

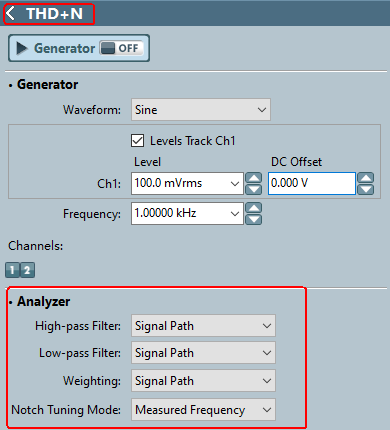
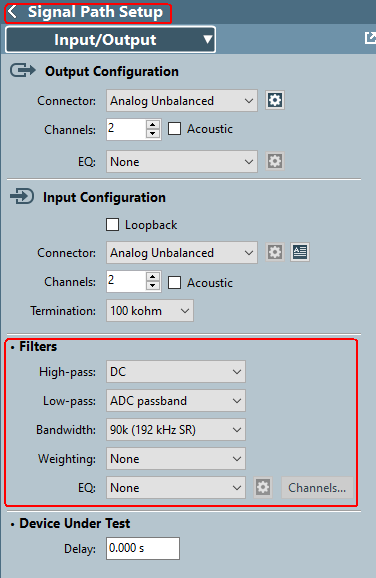
    The following picture is the APx525 setting.

  • Hi Byron,

    The picture is not showing up properly. Could you attach it again?

    Are you testing on the EVM or your own board? You may correlate the datasheet plots first.

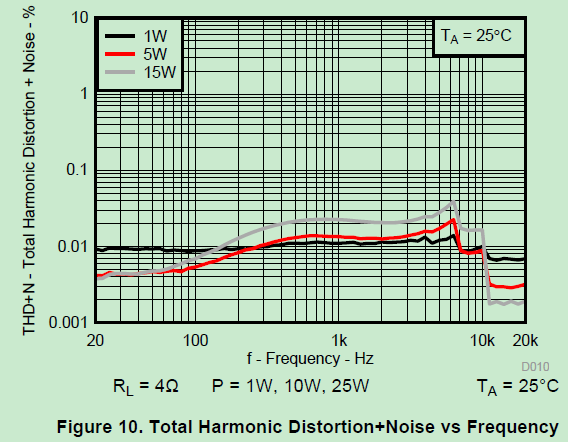
    The reason for lower THD+N ratio on d/s THD vs Freq plot is that a AES17-20k filter is used on AP setting. For frequency> ~7k, the 3rd harmonic will be over 20k and filtered out.

    Thanks!

    Regards,

    Sam

  • Hi Sam,

    Thank you for answering the question. 

    - I'm sorry for the picture can't showing up properly. Here is the picture uploaded before.

    - I'm testing TPA3250 on my own board. I don't know the reason why the THD ratio is not good compared with the datasheet. 

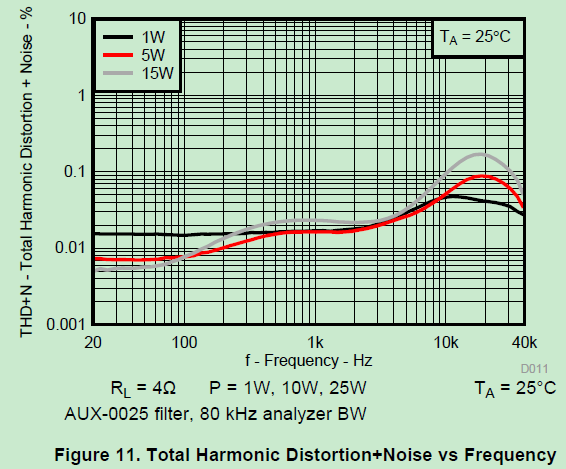
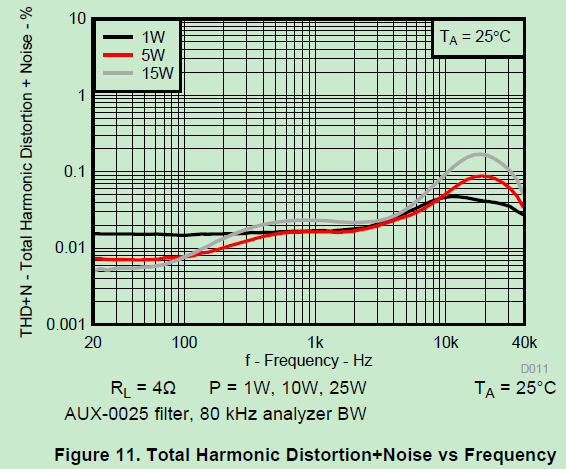
    The THD+N ratios are difference between "Figure10" and "Figure 11" in page 12 of the TPA3250 datasheet.

    Can you tell me the difference of the test setting between  "Figure10" and "Figure 11"? 

    - May I have a request to borrow a TPA3250 EVM for evaluating the performance of our own board. That will be very helpful. 

    Thanks!

    Best regards,

    Byron.

  • Hi Byron,

    The difference comes from different AP filter settings. Typically we use the AES17-20k filter for THD+N test, as shown in figure 10. If 80k BW filter is used, then the 3rd order harmonic will not be filtered out by the filter, thus the THD+N continued to rise up vs. frequency.

    You may contact with Will and he should be able to get one EVM for you. Thanks!

    Regards,

    Sam

  • Hi Sam,

    Thank you for answering the question. 

    -As what you say, the difference of the plot in "Figure10" and "Figure 11"  comes from different AP filter settings. But I don't know how to set the AP filters. Can you figure it out what I'm setting below is right or not?

    1. Figure 10 and the AP setting for figure 10:

    2. Figure 11 and the AP setting for figure 11:

    Thanks!

    Best regards,

    Byron.

  • Hi Byron,

    You Filter settings should be good. In the "Input Configuration", are you really using a unbalanced probe? Please make sure that you have selected the correct option accordingly.

    Thanks!

    Regards,

    Sam

  • Hi Sam,

    Thank you for helping me to test the performance of our own board.

    In the "Input Configuration", I'm using a "Analog balanced" probe. Thank you for pointing it out.

    The performance is a little better than the plot of the datasheet, with the test setting following your orders.

    Thanks again!

    Best regards,

    Byron.