This thread has been locked.

If you have a related question, please click the "Ask a related question" button in the top right corner. The newly created question will be automatically linked to this question.

ADS5482: Getting Harmonic peak in FFT

Part Number: ADS5482
Other Parts Discussed in Thread: CDCE62005

Hi Ti team 

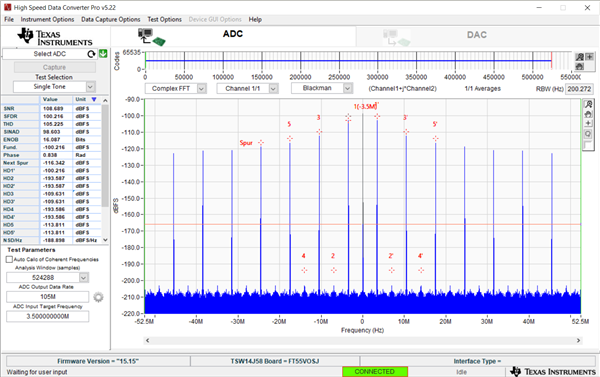
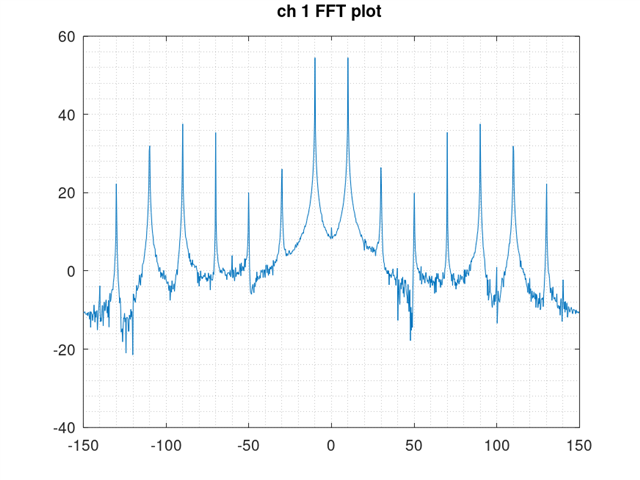
we are using ADS5482 adc in our design . our Carrier signal BW is 500khz to 20Mhz . Baseband data is 10khz and 1V. ADC clock freq is 105Mhz(LVDS), we are running adc on 105MSPS. At ADC input our signal is clean but when we are plotting FFT then we are getting harmonic . PFB image for your refernce .

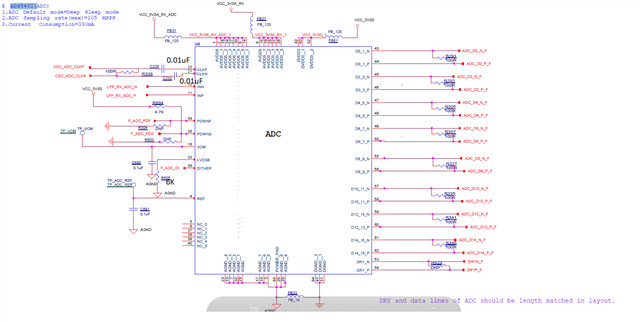
PFB our schematics image for your references
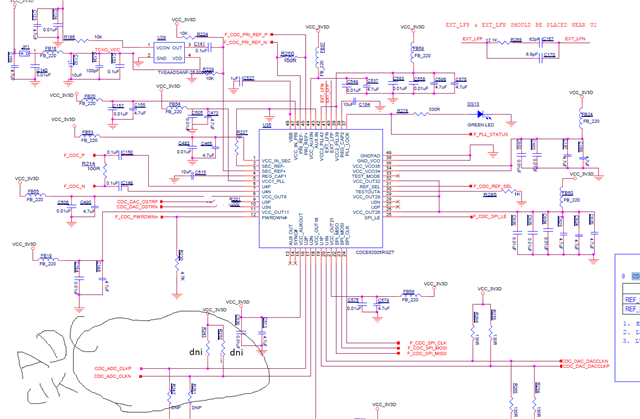
PFB our PLL.

Please suggest some review point to fix this problem.

  • Hi Ti Team 

    we have used following Octave code for FFT plot

    clc ;
    clear all ;
    close all ;
    pkg load signal ;

    adc_sampling_rate = 3*(10^2) ;
    cic_decimation_factor = 1 ;
    fir_decimation_factor = 1 ;
    Fx = adc_sampling_rate/cic_decimation_factor ;

    %%%%%%%%%%%%%%%%%%%%%%%%%%%%%%%%%%
    file_name = 'rcv_10_0_0_2.7_0_0_0_mod1_without_fltr_B2.bin'

    fid = fopen(file_name,'r');
    x = fread(fid,inf,'int32',0,'b');
    fclose(fid);
    q = x(1:2:end-1);
    i = x(2:2:end);

    z = i+j*q ;
    no_of_samples = length(z)

    ##abs_z = abs(z) ;% magnitude of signals each sample
    ##% calculate the rms value and then scale to fpga range and then convert that peak to peak
    ##rms_z = (rms(abs_z)/2^15) % peak value of signal after converting rms value to peak to peak of z
    ##max_z = max(z)/2^15 % max complex value of z
    ##abs_max_z = abs(max_z) % magnitude of max value
    ##max_abs_z = max(abs_z) /2^15 % max value of samples magnitude
    ##avg_z = mean(z) % dc value of signal
    ##avg_abs_z = abs(avg_z)/2^15 % avg dc value
    ##
    ##true_rms = rms_z - avg_abs_z % received voltage level
    ##true_pk_to_pk = true_rms * sqrt(2)*(1.65/2)
    ##

    fs = adc_sampling_rate; %sampling frequency in KSps.
    n = 1024; %number of fft points for spectrum veiwing.
    y0 = 20*log10(abs(fftshift(fft(z/2^15,n))));
    fshift0 = (-n/2:n/2-1)*(fs/n); % zero-centered frequency range


    y21 = z(1:100);
    time = (1 : 100) ;
    y21 = y21/(2^15);
    fshift21 = (1:1000);

    %%%%%%%%%%%%%%%%%%%%%%%%%%%%%%%%%%

    figure
    ## subplot(1,2,1),plot(time , real(y21)),title('DDC time domain signal');
    ## grid minor
    plot(fshift0, y0),title('ch 1 FFT plot ');
    grid minor ;
    saveas(1,strcat(file_name,"fft1.png"));


    figure
    time = (1:1:no_of_samples) ;
    ## plot(time,i/2^15);
    ## hold on ;
    plot(time(1:1000),q(1:1000)/2^15);
    hold on;
    plot(time(1:1000),i(1:1000)/2^15)
    title('ch 1 DDC time domain signal');
    grid minor ;
    saveas(2,strcat(file_name,"time2.png"));

  • Balvan,

    What mode is used for the clock from the CDCE6200 device, LVPECL, LVDS, ect...? What does the ADC data look like if you use a single-tone of say 1MHz?

    Is there a chance the input is saturating the ADC?  Does slowing down the sample clock help any? You may also want to try removing the 100 Ohm termination resistor on the clock input signals. 

    Regards,

    Jim  

  • Hi Jim 

    Clock mode is LVDS. I have tried removing the 100R resistor between the clock but nothing works. 

    Single-tone is also in distorted form.

  • I m transmitting 1.5Vppd input to ADC so no chance of saturation

  • Balvan,

    Can you please provide the data file "rcv_10_0_0_2.7_0_0_0_mod1_without_fltr_B2.bin" for us to review.

    Regards

  • Balvan,

    I think your main problem is the input clock amplitude, which needs to be at least 1.5Vpp. With an LVDS input, I do not think you are achieving this level. I would suggest using LVPECL from the CDCE62005. In this mode install the required termination by using 150 Ohms for R251 and R242.

    Regards,

    Jim

  • Sorry for the late reply .can you please share your email id so i can mail you. Because i am not able to attach that file here

  • Yes Jim our clock amplitude is 1.2Vppd.But in datasheet its is not mentioned that it should be atleast 1.5Vppd. They have mentioned 1Vppd to 3Vppd range. Also in datasheet it is written is clock should be 1vppd for good performance.

  • Hi Balvan,

    Please send the data to the email address in the PM.

    Regards

  • Please see below. Minimum clock amplitude is 1.5V not 1V.


  • Hi Jim CLK description section it is written 1Vpp to 3Vpp.

    see below 

    .Okay i will try with LVPECL standard and let u know the result.

  • HI

    Any update? as i already sent u the file.

  • Hi Balvan,

    Apologies for the delay.

    Below shows how the data "rcv_20_1.5Vpp_G1_50R_mod1_B2.bin" looks once imported into HSDC Pro. When this data was captured, the input appears to have been a 3.5MHz signal. Note that this plot is using int32 as the CSV data format and HSDC Pro accepts int16 as the data format, this discrepancy is causing the shift such that the fundamental is down into the -100 dBFs region.

    HSDC Pro Capture

    Below is the code used to convert your binary file into CSV for import into HSDC Pro using MATLAB. I suggest that you capture and parse your data as int16 (as there is no benefit for using int32) and then import into HSDC Pro to verify that the data capture method has no issues, before attempting to plot the data on your own. Since I am not familiar with Octave, I cannot assist any further by looking into your code. I hope this helps you to locate and resolve the issue. 

    Fullscreen
    1
    2
    3
    4
    5
    6
    7
    8
    9
    10
    11
    12
    13
    14
    15
    16
    file_name = 'rcv_20_1.5Vpp_G1_50R_mod1_B2.bin';
    fileID = fopen(file_name);
    X = fread(fileID,'int32');
    fclose(fileID);
    window = 524288;
    i = X(2:2:end);
    q = X(1:2:end-1);
    i = i(1:window);
    q = q(1:window);
    writecell(num2cell([int32(i), int32(q)]), 'csv_data.csv') % Save to csv file
    % NOTE: HSDC Pro only accepts the int16 data format. If initial binary data is parsed into int16, the data does not plot correctly. Resolve this parsing issue and plot using HSDC Pro before attempting to plot using Octave code.
    XXXXXXXXXXXXXXXXXXXXXXXXXXXXXXXXXXXXXXXXXXXXXXXXXX

    Regards