This thread has been locked.

If you have a related question, please click the "Ask a related question" button in the top right corner. The newly created question will be automatically linked to this question.

ADS42LB69: Spectrum abnormalities

Part Number: ADS42LB69

Hi team,

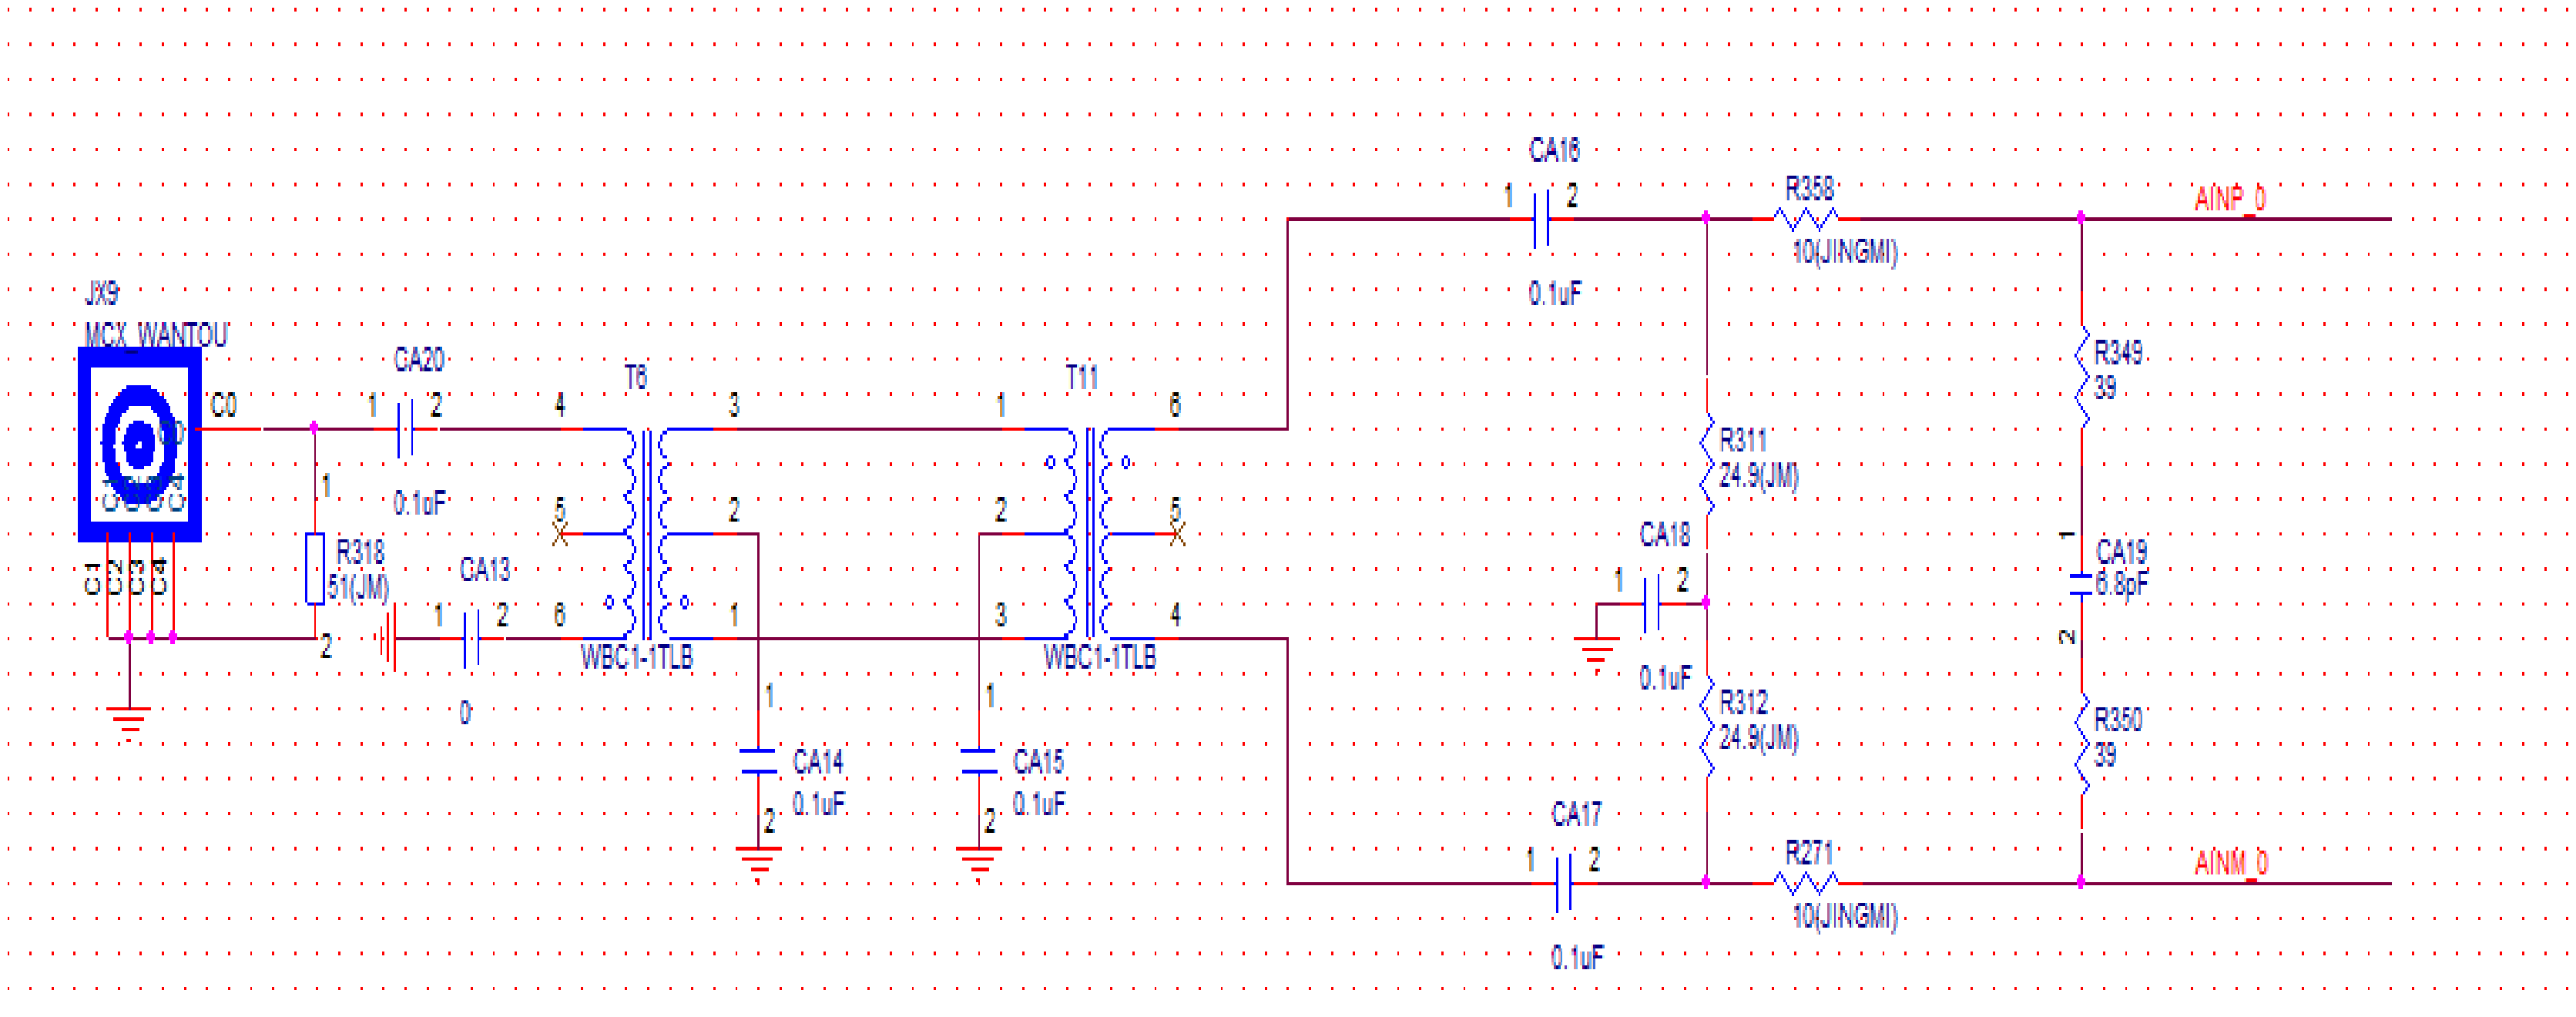
Input external clock sampling rate 204.8M, at input signal 0DBM, center frequency 153.7M, band pass filter added to the outside of the signal, spectrum is basically normal, The spur is very small and basically conforms to the characteristics of the device. However, when the input signal reaches -22~-40dbM, the spur on both sides of the signal increases and does not decrease as the signal input amplitude decreases. See the yellow text in the figure below. The problem has been found on several different boards, and the main question now is why when the signal input amplitude decreases, the clutter on both sides increases. We suspect this is a problem with the ADC itself sampling. The problem with the signal source and the clock can be eliminated. The second figure is our front-end circuit.

Best Regards,

Amy Luo

  • Hi Amy,

    We are working on getting you an answer for this. Thank you for your patience.

    Regards,

    Drew

  • Add: This phenomenon occurs only in the input signal -22~-40dbM range.

  • Hi Amy,

    Thank you for the added clarification. We understand that the problem appears when the input amplitude is from about -22 to -40 dBm.

    What are the frequencies that you see as spurs surrounding the fundamental tone? 

    In addition, are you using our ADS42LB69EVM to evaluate the board, or have you built a setup yourself? If the latter, a full system schematic could be quite helpful.

    Thanks,

    Drew

  • Hi Amy,

    Based on our testing using your values, your spurs appear to be odd order harmonics of the fundamental tone. I was able to identify HD3 through HD19 with my signal generator set at -22dBm.This placed my fundamental tone at about -35 dBFS (yours looks close to -31 dBFS). I did notice the spurs were lower at higher amplitudes and similar at lower amplitudes, generally disappearing around -70 dBFS (or -50 dBm input).

    The reason they are gathered so close is due to your input signal frequency (153.7 MHz) with respect to your clock frequency (204.8 MHz). Your ordd harmonics are almost folding over exactly onto your fundamental from other Nyquist zones. Adjusting your frequency slightly will start to smear the harmonics across a wider band, which will allow your filter to reduce them even further.

    The levels of the odd harmonics are close to -95 dBFS. This within the performance expected of this device if you reference the datasheet. SNR is 73.6 dBFS, with a typical value of 73.2 dBFS for 170 MHz. Proper frequency planning will, as mentioned, allow you to use a filter to reduce these harmonics further.

    Hope this helps.

    Thank you,

    Drew

  • Hi Drew,

    I would also like to figure out this: 

    Why is this particularly noticeable when the input amplitude is between -20 ~ - 40dBm?

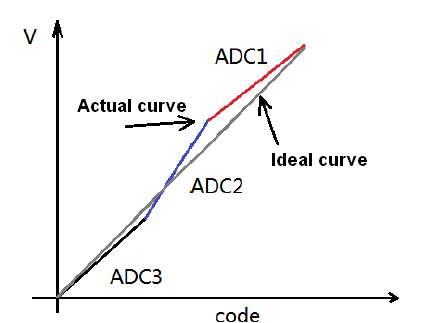
    What I understand is that this is related to its internal working principle, the ADS42LB69 is a pipeline structured ADC, and each level of Flash ADC does not match perfectly, making the ganging interval non-linear, as shown below. As a result, performance is reduced at a certain amplitude.

    Is my understanding correct

  • Hi Amy,

    Yes, I would agree that the anomaly given the specifications with which we are working is the result of inter-stage gain error, which is effectively what you have illustrated.

    Thank you for the opportunity to explore this issue in depth. If you have any additional questions, feel free to start a brand new thread. I will go ahead and close this one.

  • Thank you for your support, I have no more question about this.