This thread has been locked.

If you have a related question, please click the "Ask a related question" button in the top right corner. The newly created question will be automatically linked to this question.

ADS1675: Wide-bandwidth Stop Band Attenuation

Part Number: ADS1675

In the datasheet for the ADS1675, the second paragraph of the Description on page 1 says that the Wideband path has a stop band attenuation of 86dB. This is also listed in the datasheet on page 3 under DIGITAL FILTER CHARACTERISTICS (WIDE-BANDWIDTH PATH), Stop band attenuation = 86dB.

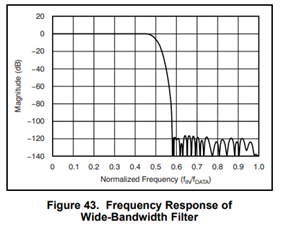
On page 21, figure 43 seems to show the stop band of the frequency response to be approximately 115dB. 

Can you explain where the 86dB comes from, when the filter response looks like 115dB?

Adding to the confusion, the Revision history shows that the 86dB was once 115dB in a previous revision of the datasheet.

  • Hello Michael,

    First, welcome to the TI E2E community.

    The digital filer response is accurately shown in Figure 43, and reflects an attenuation of 115dB in the stop-band. 

    However, for out-of-band frequencies (greater than 1/2*data rate), there are regions where inter-modulation occurs, creating response peaks that exceed the digital filter stop-band attenuation.  These are shown in Figure 46 of the datasheet.  The worst case region is 86dB, not including the pass-band regions at multiples of the modulator frequency.

    Stop-band attenuation is improved when used in conjunction with an anti-alias filter at the ADC input.

    Regards,
    Keith Nicholas
    Precision ADC Applications

  • Thanks, that is helpful. So if I want to avoid that 86dB inter-mod product from aliasing into my passband, I need to design my anti-aliasing filter to knock down that signal? Is there a way to calculate where that 86dB signal will fall in a given design? I'm planning on a decimation by 32, so it is a different rate than shown in Figure 46.

  • Hi Michael,

    I did a little more digging.  In the case of the ADS1675, this is the actual response of the digital filter, and not intermodulation distortion.  These peaks in the stop-band will alias into the transition region and not the pass-band, so the assumption is these aliased signals will not interfere with any pass-band signals of interest.

    In any case, for an OSR=32, the peaks will scale by a factor of 4 relative to Figure 46, which uses OSR=8.  With OSR=32, the first peak will be at 1.5MHz and the second peak at 2.5MHz.  Below is another plot that I found for OSR=8; just divide the x-axis by 4 when using OSR=32.  This plot assumes that the clock frequency is set to 32MHz.

    If you are concerned about aliased signals in the transition region, then your anti-alias filter can be designed to further reduce these signals by several dB depending on where you place the corner frequency and the filter order.

    Regards,
    Keith