Part Number: ADC3683EVM
Dear All,
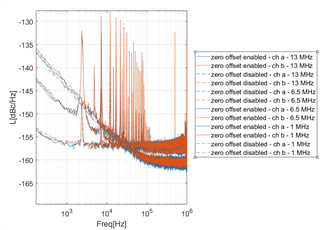
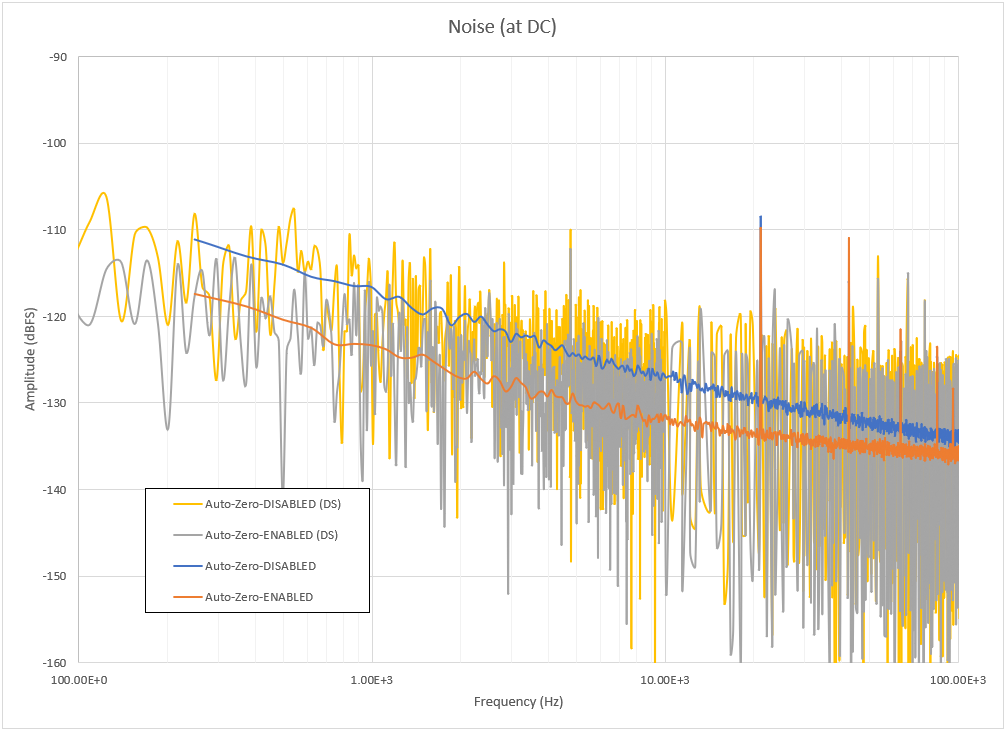
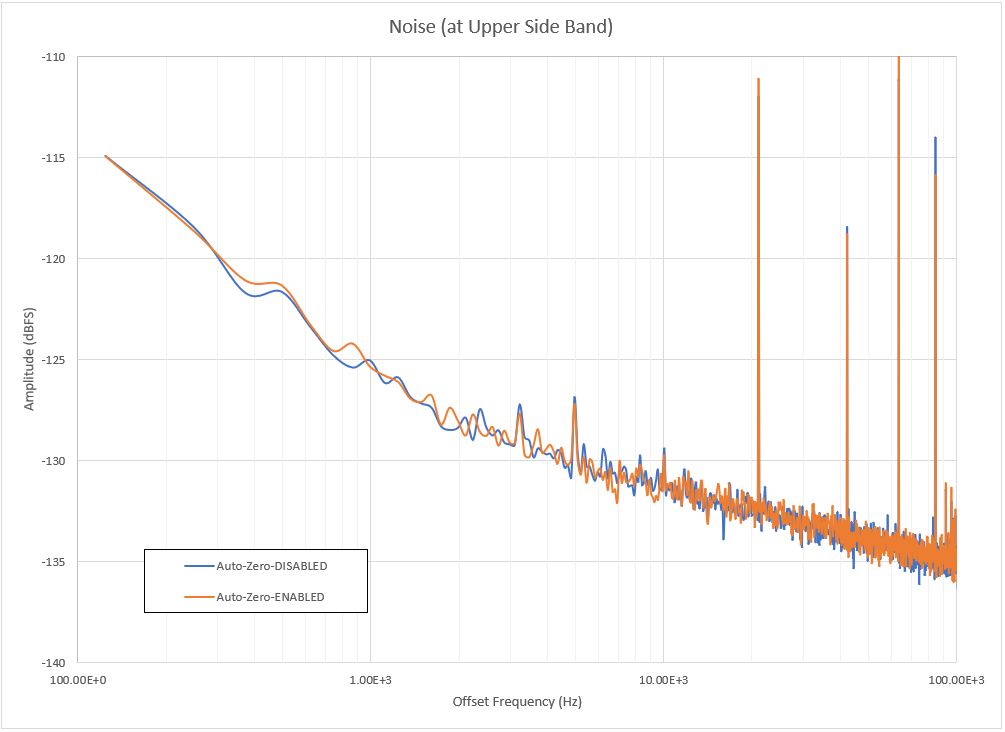
I am trying to sample with 65 MSPS. I tried various input frequency 1 MHz 6.5 MHz and 13 MHz. I tried to enable/disable the Auto-Zero by writing to address 0x11 a 0x1 (Enable) or a 0x0 (Disable). By reading the register back I see the values are being written.
The spectrum in the 1/f region (100 Hz - 10 kHz) looks the same for both cases (AZ enabled or disabled). I am wondering whether the functionality is really enabled / disabled ? I guess I am doing something wrong...any idea?
Best,
Uros