Other Parts Discussed in Thread: AFE4960P, , AFE4960EVM, MSP430F5528, AFE4960
Tool/software:
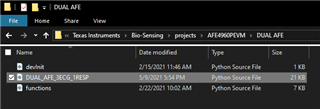
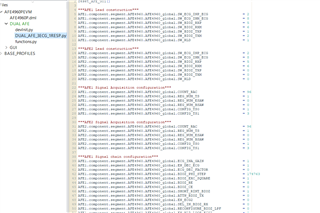
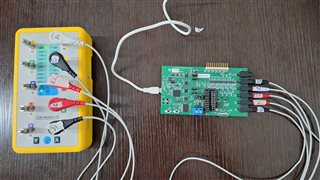
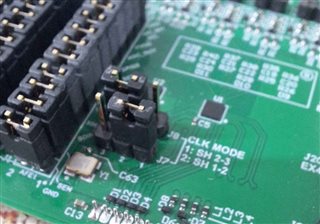
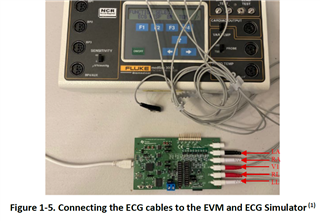
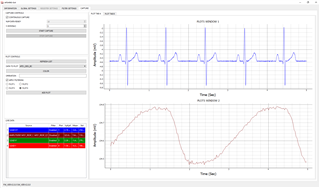
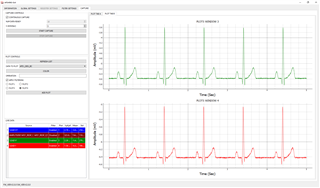
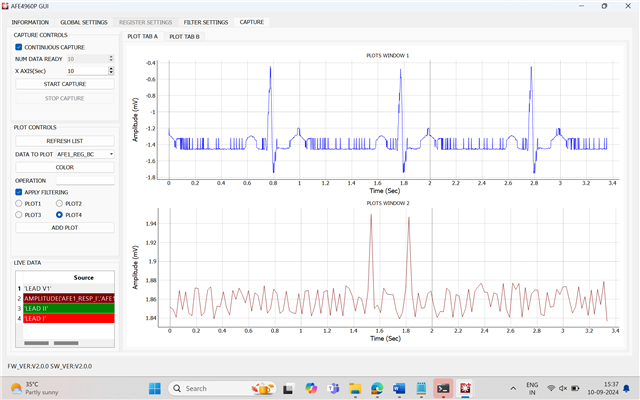
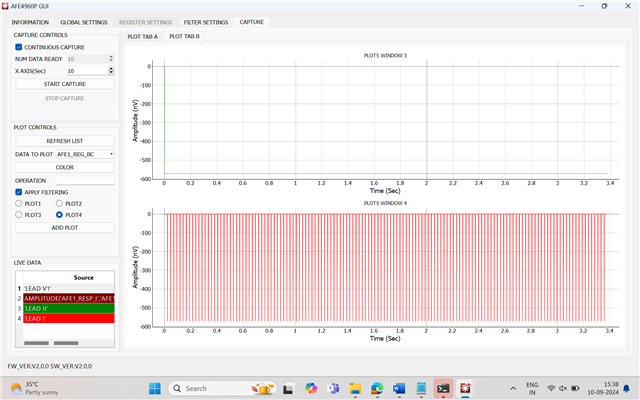
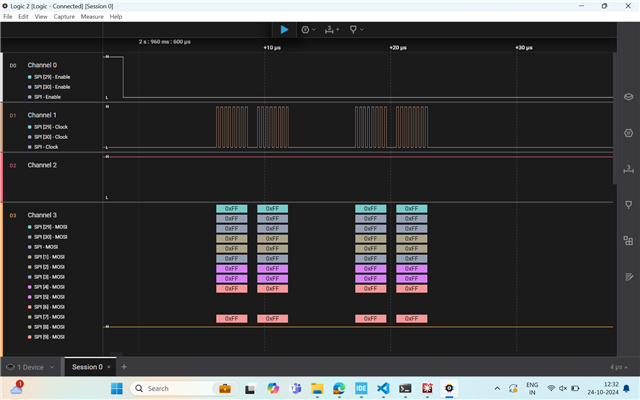
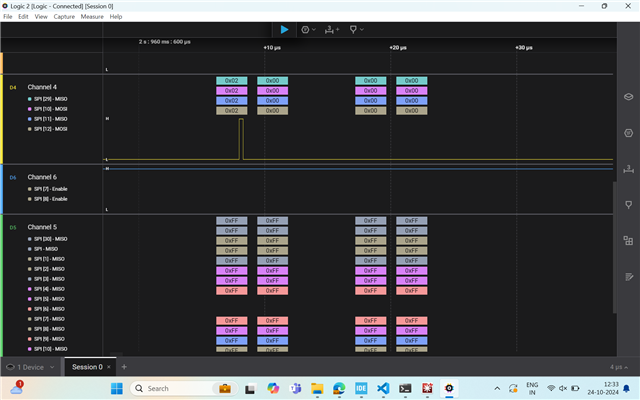
Hi, I am using AFE4960PEVM and related biosensing software to visualize Lead 1 configuration ECG waveform. The wave forms are created using a simulator. I followed the instructions as per "Design Example – 5-Lead ECG Pg 249" from the AFE4960P datasheet. Both the plots/channels of AFE2 shows only noise in the graph. While AFE1 graph shows appropriate wave form as per configuration. I suspect AFE2 isn't working as I could see the wave form of lead 1 if I configure the AFE1 registers to process the LA and RA electrodes. I am using the stock py script provided by the bio sensing software and verified the values as per the "Design Example – 5-Lead ECG Pg 249". What else should I do to, in order to make the AFE2 work?