This thread has been locked.

If you have a related question, please click the "Ask a related question" button in the top right corner. The newly created question will be automatically linked to this question.

ADS1299: Collecting small signals, with correct amplitude but incorrect frequency

Part Number: ADS1299

Tool/software:

I bought a EEG signal generator that can generate low-frequency small signals, and I want to verify the correctness of my acquisition board. The signal generator is set to output a sine signal with an amplitude of 50UV and a frequency of 10Hz. Then my acquisition board went to collect and displayed the waveform. The amplitude was correct, but there was an offset. And the frequency is incorrect, around 20hz. Then I tried a sine signal with a frequency of 4 Hz and collected results with a frequency of 9 Hz. May I ask what the reason is? My ADS1299 has a sampling rate set to 250Hz and a gain of 24. I saved the data of channel one as a CSV file and processed it using Python. Here is my code:

import pandas as pd
import numpy as np
import matplotlib.pyplot as plt

data = pd.read_csv(r'C:\Users\sun\Desktop\250-4.csv')

voltage = data['Voltage'].values


fs = 250
n = len(voltage)
t = np.arange(n) / fs


fft_result = np.fft.fft(voltage)
fft_freq = np.fft.fftfreq(n, 1/fs)


positive_freqs = fft_freq[:n//2]
positive_fft = np.abs(fft_result[:n//2]) * (2/n) # 归一化


plt.figure(figsize=(10, 5))
plt.subplot(2, 1, 1)
plt.plot(t, voltage)
plt.title('Original Voltage Waveform')
plt.xlabel('Time (s)')
plt.ylabel('Voltage (V)')
plt.grid()

plt.subplot(2, 1, 2)
plt.plot(positive_freqs, positive_fft)
plt.title('FFT of the Voltage Signal')
plt.xlabel('Frequency (Hz)')
plt.ylabel('Magnitude')
plt.xlim(0, fs/2)
plt.grid()

plt.tight_layout()
plt.show()
  • Hello Di,

    Can you share the CSV file with the raw data? Have you verified with an oscilloscope that the signal generator is outputting the expected waveform? You may have to increase the amplitude to see it clearly on a scope, but at least you can verify the sine wave frequency.

    Regards,

    Ryan

  • Firstly, thank you very much for your reply. I will reply to you in sections.
            Firstly, my CSV file contains the converted actual voltage values, which are placed in a column of the table. The first row is named Voltage, and I will copy a portion of it for display later.
            Secondly, the oscilloscope equipment on my end is a bit outdated and has not been properly tested yet. The signal generator is a product purchased from someone else, so generally speaking, there is no problem. I will confirm the waveform of the signal generator as soon as possible.
             Also, I would like to ask you a few more questions.
    Problem 1: When reading registers, typically 27 bytes are read. The first three bytes are status bits, and the last 24 bytes are data from eight channels. When processing data, I combine three bytes together and convert them into actual voltage values based on LSB, MSB, and formulas. That is to say, a data point is composed of three bytes. When the sampling rate of ADS1299 is set to 250Hz, it is equivalent to collecting 250 points per second. However, since a point is composed of three bytes, when processing data for FFT transformation, is fs set to 250 or 250/3 in the above code.
    Question 2: I transmitted the actual voltage values collected by ADS1299 to the serial debugging assistant, but when I modified the sampling rate of ADS1299, I found that there was not much data on the serial debugging assistant. That is to say, increasing the sampling rate did not cause significant changes. Simply put, modifying the ADS1299 sampling rate did not take effect.

    Here is one of my CSV files, with a sampling rate of 250Hz and a collected signal of 4Hz and 50UV:

    Voltage
    0.000019
    0.000021
    0.000022
    0.00002
    0.000016
    0.000011
    0.000004
    -0.000003
    -0.00001
    -0.000017
    -0.000022
    -0.000025
    -0.000027
    -0.000025
    -0.000023
    -0.000018
    -0.000011
    -0.000004
    0.000003
    0.00001
    0.000015
    0.000019
    0.000022
    0.000022
    0.000019
    0.000015
    0.000009
    0.000002
    -0.000005
    -0.000013
    -0.000018
    -0.000023
    -0.000026
    -0.000027
    -0.000026
    -0.000022
    -0.000017
    -0.00001
    -0.000003
    0.000004
    0.00001
    0.000016
    0.00002
    0.000021
    0.00002
    0.000018
    0.000013
    0.000007
    0
    -0.000007
    -0.000014
    -0.00002
    -0.000024
    -0.000027
    -0.000027
  • Hello Di,

    The sampling rate the ADS1299 will be 250 SPS for all 8 channels. The data is represented by 24 bits or 3 bytes, but this has no effect on the sampling rate. Your FFT should plot from 0 to fs/2 or 125 Hz. 

    When changing the data rate, you must be writing the new DR[2:0] configuration in address 01h. Are you reading back the register value to confirm the new configuration was written correctly? If the new register values are not matching, you may want to confirm that the device is not operating in RDATAC mode. You must send the SDATAC command (11h) before RREG/WREG.

    Regards,

    Ryan

  • May I ask if there is any problem with the code I used to process the data above, and what value should be set for fs? I tested the internal square wave signal and found that the waveform amplitude was correct during acquisition, and the waveform was also a square wave signal. However, the frequency was also incorrect when running the data processing code mentioned above. I modify the value of fs, and the frequency is also changing. However, by keeping fs unchanged during data processing and changing the frequency of the signal generated by the signal generator, the frequency variation can be observed. So I think there should be a problem with the sampling rate or my data processing method.

  • Hi Di,

    Please probe the nDRDY pin of the ADS1299 on an oscilloscope. The period between consecutive falling edges should exactly match the data rate period you have configured. Otherwise, something is incorrect in the clock or register settings.

    Regards,

    Ryan

  • Hi Ryan

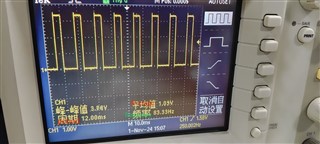
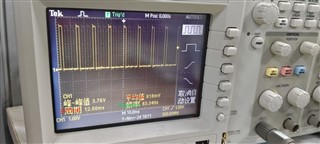
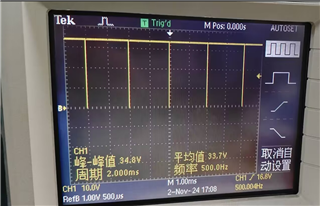
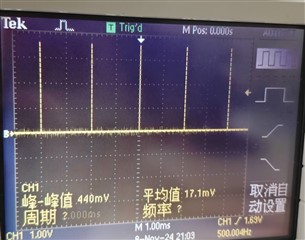
    I set the sampling rates of ADS1299 to 250Hz and 500Hz respectively, and then observed the waveform of the DRDY pin with an oscilloscope. The results obtained are shown in the following figure.

                                             figure1  250hz

                                                figure2 500hz

    May I ask if there are any issues with the waveform of the DRDY pin corresponding to these two sampling rates. All waveforms are measured during data transmission. But my current collected waveform still has the correct amplitude. If we calculate the spectrum according to fs=250hz. There is still an issue with the spectrogram, as the frequencies do not correspond. May I ask if there are any other possible reasons. My FTT calculation code is already on it. How can I solve the problem of incorrect frequency.

  • Hi Di,

    Please measure the nDRDY period between consecutive falling edges without any SPI communication following your register configuration. Place vertical cursors on the scope and let me know the Δt. Based on the time scale in your waveform, the period is more than 10ms, which equates to < 100 Hz.

    Regards,

    Ryan

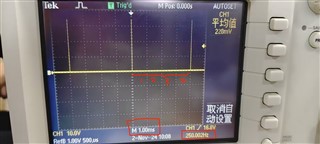
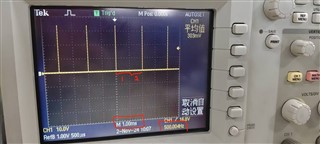
  • I don't know why SPI communication is not used to measure DRDY signals. I just commented out the read data code in the main function of the code, which may prevent SPI communication. Then, when I set the ADS1299 sampling rate to 250Hz, the measured DRDY signal is shown in Figure 1, and when the sampling rate is 500Hz, the DRDY signal is shown in Figure 2. In the figure, M1.00ms represents 1.00ms per cell, so in the 250Hz graph, the distance between the two falling edges is 4 cells, which is 4ms. The same applies to Figure 2.

                                            figure1

                                          figure2


    Then when I enabled SPI communication, I set 250Hz and 500Hz just like the two pictures I sent you last time. When SPI communication is enabled, the period of DRDY signals at 250Hz and 500Hz is 12ms, and the frequency is 83.3Hz. Where is the problem. So much so that when I process the collected data and perform FFT transformation, I need to set the sampling rate Fs to 83 in order to obtain the correct signal frequency. But this can only handle signals within fs/2, which is 83/2, correctly. The sampling rate is related to the DRDY frequency, so I think it should be due to DRDY. However, without SPI communication, I feel that testing the DRDY signal is not a problem.

  • My main loop code is shown in code, which detects whether the DRDY signal and data are ready by checking the flag bits. Then read the data, process it, and transmit it via serial port. But when I commented out the code for data processing and serial port transmission, I measured the DRDY signal as shown in Figure 2. It can be seen that the frequency and sampling rate of the DRDY signal during SPI communication are consistent at 500Hz. But the DRDY signal waveform at the 500Hz sampling rate before SPI communication is not quite the same. You can compare it.
    So, from the situation described above, what is the reason for it? Is it because my data processing and serial port transmission wasted time and affected the DRDY signal?

    code:

    while (1)
    {
    if (drdy_flag)
    {
    ADS_Read(ADS_Data);
    SendFirstChannelData(ADS_Data);
    drdy_flag = 0;
    }
    }

                                           figure2

  • Hi Di - so you are comparing these two images below?:

    1 - before SPI:

    2 - after SPI:

    I wonder if this is caused by how your MCU has configured the pin connected to the ADS1299 /DRDY. It seems to be loading the pin and pulling it high. As mentioned earlier, the /DRDY pin should idle low if no data is read from the device. Otherwise, if there is activity on SCLK, the first SCLK falling edge will clear the /DRDY interrupt on the ADS1299, such that it returns high and waits for a new conversion.

    Regards,

    Ryan

  • Hi   Ryan,

    The main problem I am currently facing is that the sampling rate is only 83.3Hz, and the DRDY frequency is 83.3Hz. So may I ask if the frequency of the DRDY signal remains consistent with the ADS1299 sampling rate during SPI communication? Then, when SPI communication is not performed, it is basically at a low level as shown in Figure 1:

  • Hi Ryan,

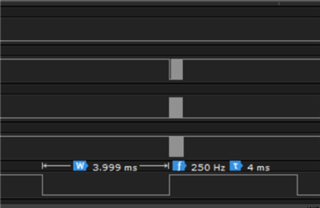
    I will show you the results of my logic analyzer measuring SPI communication. As shown in Figure 1, before reading channel data, the DRDY signal remains low and appears to have a pulse signal. When starting to read, DRDY becomes high level. There are also a few detailed pictures of scaling up later. Please check if there are any issues with SPI communication.

  • Hi Di, 

    Yes, during SPI communication, the data rate period remains exactly the same. However, for debug purposes, it is easiest to observe the /DRDY waveform on a scope without active SPI communication. As I mentioned, the first SCLK falling edge clears the interrupt, so this produces a varying /DRDY=LOW pulse width. Falling edge to falling edge will still be consistent in that case as well.

    The figure above is correct for /DRDY interrupts @ 500 SPS without reading data.

    Regards,

    Ryan

  • Hi Di,

    After the /DRDY falling edge, you are waiting almost 4 ms to respond and read the data. Yet the date rate you have configured has a 2-ms period. 

    1. Reduce the delays from /DRDY falling edge to data capture

    2. Keep /CS low throughout the entire 27-byte frame. You may need to use a dedicated GPIO rather than the native SPI_CS signal in your MCU.

    Regards,

    Ryan