This thread has been locked.

If you have a related question, please click the "Ask a related question" button in the top right corner. The newly created question will be automatically linked to this question.

ADS1255: INL Shape Clarification

Part Number: ADS1255
Other Parts Discussed in Thread: ADS1256, , ADS127L21B

I'm looking for clarification on a point raised in a previous forum post regarding the ADS1256's linearity and INL calibration. It was mentioned that the INL curve "shape" varies between individual units.

While I expect minor variations. such as the exact location of peaks/valleys, absolute min/max values, or whether the curve trends positive or negative. Does the INL typically follow a consistent "bow" or sinusoidal shape centered at 0,0 across different devices, or is the profile entirely random for each unit?

For my application I'm using a weigh scale that utilizes only a small portion of the Full-Scale Range (FSR). I perform a two-point calibration (min and max weight) to the ADC codes. Is it correct to assume that by narrowing my operating range and calibrating based on the two points, the error contribution from INL becomes proportionally smaller?

Essentially, if I only use 10% of the FSR, can I expect the "local" non-linearity to be significantly lower than the datasheet's maximum INL specification?
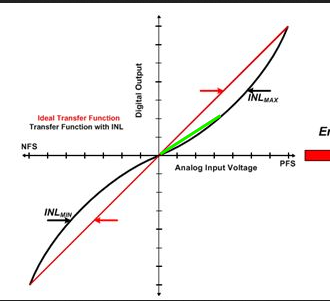
INL.png

  • This image above is just for demonstration purpose, The ADS1255 INL curve looks more like this with the green line being my operating curve

  • Hi TI TI,

    While I expect minor variations. such as the exact location of peaks/valleys, absolute min/max values, or whether the curve trends positive or negative. Does the INL typically follow a consistent "bow" or sinusoidal shape centered at 0,0 across different devices, or is the profile entirely random for each unit?

    I'm not sure I'd use the word "consistent" to describe the INL shape, but they should all look approximately like the plot you included in your second post.

    For my application I'm using a weigh scale that utilizes only a small portion of the Full-Scale Range (FSR). I perform a two-point calibration (min and max weight) to the ADC codes. Is it correct to assume that by narrowing my operating range and calibrating based on the two points, the error contribution from INL becomes proportionally smaller?

    Essentially, if I only use 10% of the FSR, can I expect the "local" non-linearity to be significantly lower than the datasheet's maximum INL specification?

    The INL is typically calculated using the box method. That means we measure the INL across the input range, then select the min and max value within that range and divide by the FSR to get the spec you see in the datasheet. So it is possible the INL will be "worse" in your limited range, even though of course the INL behavior itself hasn't changed

    -Bryan

  • Hi Bryan, you're last point seem very counter intuitive to me. If I consider the second image I posted, at 25C , if my range was 0~3.5V my worst case INL would be ~(-0.0002)%FSR at ~1.5V; FSR being 4*Vref/PGA.

    This mean If I calibrate to 0 and 3.5, then at 1.5V I can expect the accuracy of my output to be ~0.002%*FSR out.

    If instead I reduce my range to 0-1.5V and calibrate to those points, I could theorize that my worst-case INL will be between those points but it should be less than the full scale since I'm closer to the curvature. I understand its not a uniform curve but you could approximate it as such?

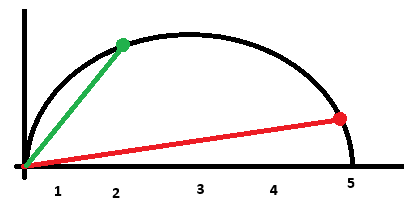
    Here is a very crude image of what I mean. The vertical axis is the INL, the horizontal axis is the input voltage. If the black trace is the INL over half the full range, the red trace would see more INL error than the green if you were calibrating your process to the endpoints of each line. You're already taking the INL into account at those end points during your calibration.


    How could it worse? The INL curve should not change just because you use less of the range.

    When you say the "Box Method" do you mean Box plots?

    Thanks

  • Hi TI TI,

    To clarify, the shape of the INL plot isn't changing, my point was about the specification itself and how it is determined. Specifically, the spec is determined with respect to the full scale range (FSR), so you can think of it like an offset. If the INL spec is 1uV with respect to FSR e.g. 5V, this will have a much larger impact on a 1mV signal compared to a 1V signal. Or, another way of thinking about it: you can see that in your example the maximum INL error in your plot is almost the same if the input signal is 2V (the green line) versus 5V (the red line). Again, the shape isn't changing, but how much this impacts your measurement might.

    Note that I misspoke about the box method, which is typically used for drift specifications. The INL is typically characterized using the endpoint method to determine the maximum deviation of the ADC transfer function from the ideal

    The box method is described in slides 3 and 4 of this video, and is different compared to the link you provided: https://www.ti.com/video/series/precision-labs/ti-precision-labs-analog-to-digital-converters-adcs.html?videoId=6343452699112

    -Bryan

  • Thank for your help with this Bryan, I may need to provided more context. 

    What I was trying to get at with my second image, was that if I were to do a straight line interpolation calibrated to the Red and Green lines, the Green line would see less of a INL related error. In the sense that If I hang a 1kg weight on a loadcell and its outputs 2V, but the ADC outputs a count for 2.0005V, that 0.0005 error doesn't matter, all that matters is 1kg = 2.0005. Some of the INL error has been calibrated out.

    Where as in the case of the red line, while the INL error is lower than the green calibration point, the distance between my calibration line and the actual INL error is larger. so when I'm at a midscale value there will be more of an error due to the no linearity. 

  • Hi TI TI,

    Note that the FSR includes gain, so if you gain up your input signal then you will be using more of the FSR. I don't know much about your system, so I cannot be sure how much gain you will use or your reference voltage. So this is just a general comment

    I agree that if you calibrate at two points (min load and max load), then the remaining error should effectively just be linearity. And that the linearity should be less than the total INL as you described

    If you want super low INL you can also consider the ADs127L21B, which has <1ppm max INL over a limited temp range. This device does not have a gain stage, but again for best performance you might consider building discrete components, especially if you don't actually need fixed gain.

    -Bryan