This thread has been locked.

If you have a related question, please click the "Ask a related question" button in the top right corner. The newly created question will be automatically linked to this question.

The FFT of the data captured by the GUI (ADC4229 test with TSW1400)

Other Parts Discussed in Thread: ADS4229

Hello 

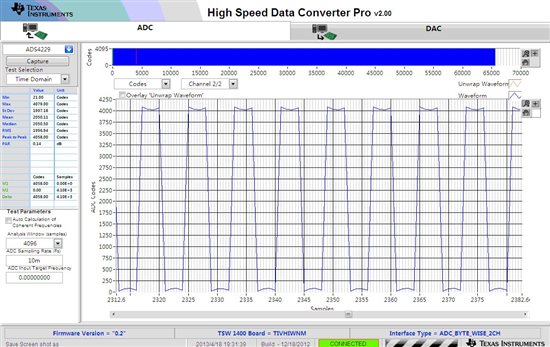
When i test DAC4229 with tsw1400, I set the analog input frequency for 2.5MHZ (sinwave  200mvpp) and sampling frequency for 20MHZ,I get the Time Domain  as  following .

You can see the  top of the graph is concave and the bottom is convex , it does not like the   data  captured  form sinusoidal signal  and after i change the sampling frequency and  analog input frequency ,I always can't get the graph which should be similar to the triangle wave  . is the GUI settings incorrect or other reasons ?

  • Hi Taochang,

    This looks like a 2's complement and offset binary data format problem.  Check the EVM JP14 to see if it is set for 2s complement or offset binary - you can refer to the EVM usersguide for details.  The HSDC Pro GUI expects offset binary data.  If you have the ADS4229 GUI open you can also toggle this in the Format setting of the device GUI.

    http://www.ti.com/lit/ug/slau333/slau333.pdf

    Ken.