Hello
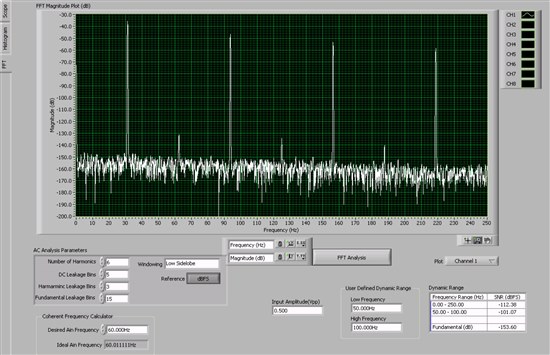
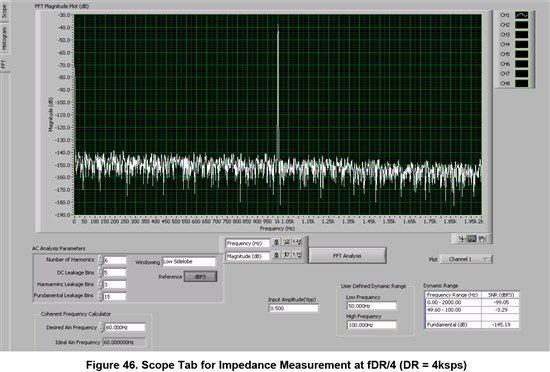
I have a question regarding the interpretation of the FFT Analysis for impedance measurement, figure 45&46 of this data sheet:
http://www.ti.com/lit/ug/slau443/slau443.pdf
shows the analysis for impedance measurement at 31.25Hz, how can one tell by looking at this plot that a 5KOhm impedance is present? I understand the reason there's something present at 31.25Hz but not that magnitude.
figure 46 also shows the impedance component at 1KHz after changing the frequency and data rate to fdr/4 and 4Ksps but how does one extract the impedance value from this graph too?
Any help would be appreciate it!
thanks
thanks again
Rafael


