This thread has been locked.

If you have a related question, please click the "Ask a related question" button in the top right corner. The newly created question will be automatically linked to this question.

AFE4400 LED1 DATA analysis

Other Parts Discussed in Thread: AFE4400

Hi all,

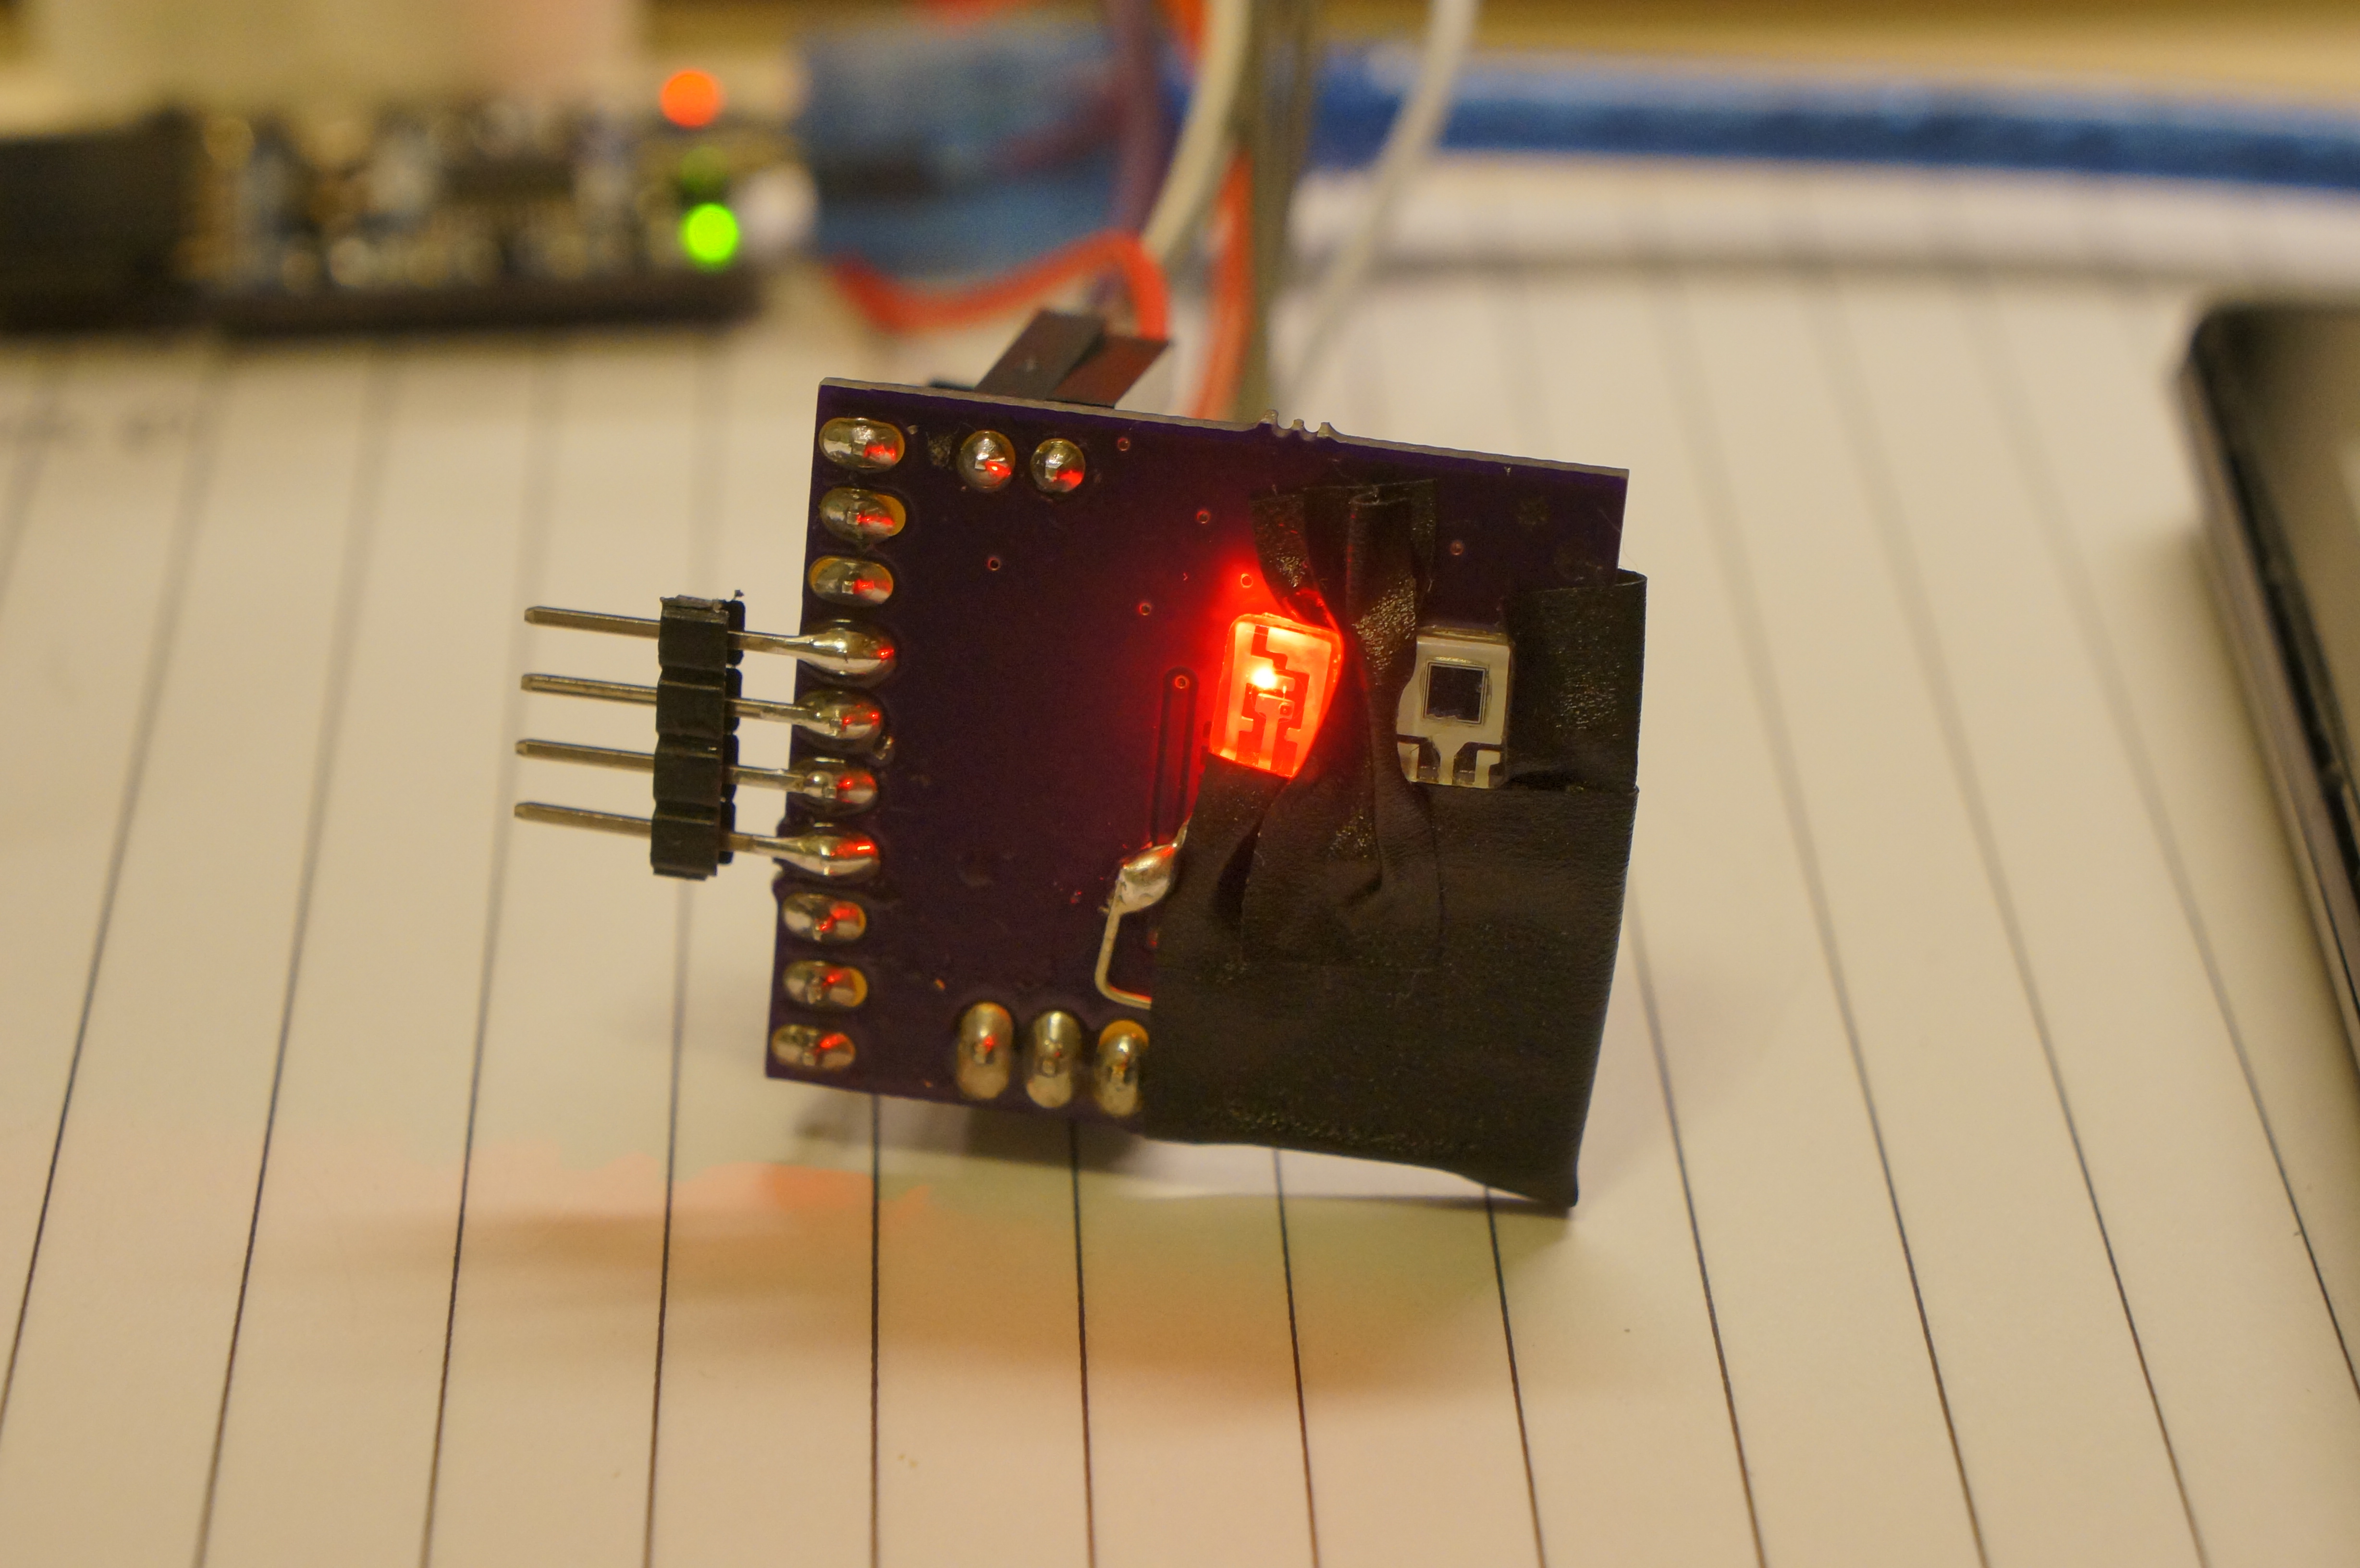
I've build a AFE4400 breakout board, and I'm sure AFE4400 is working fine (Bandgap voltage,4 Mhz CKOUT,DIAG=0....)

the sensor is DLED-660/905-CSL-2 plus PIN-4.0-CSL 

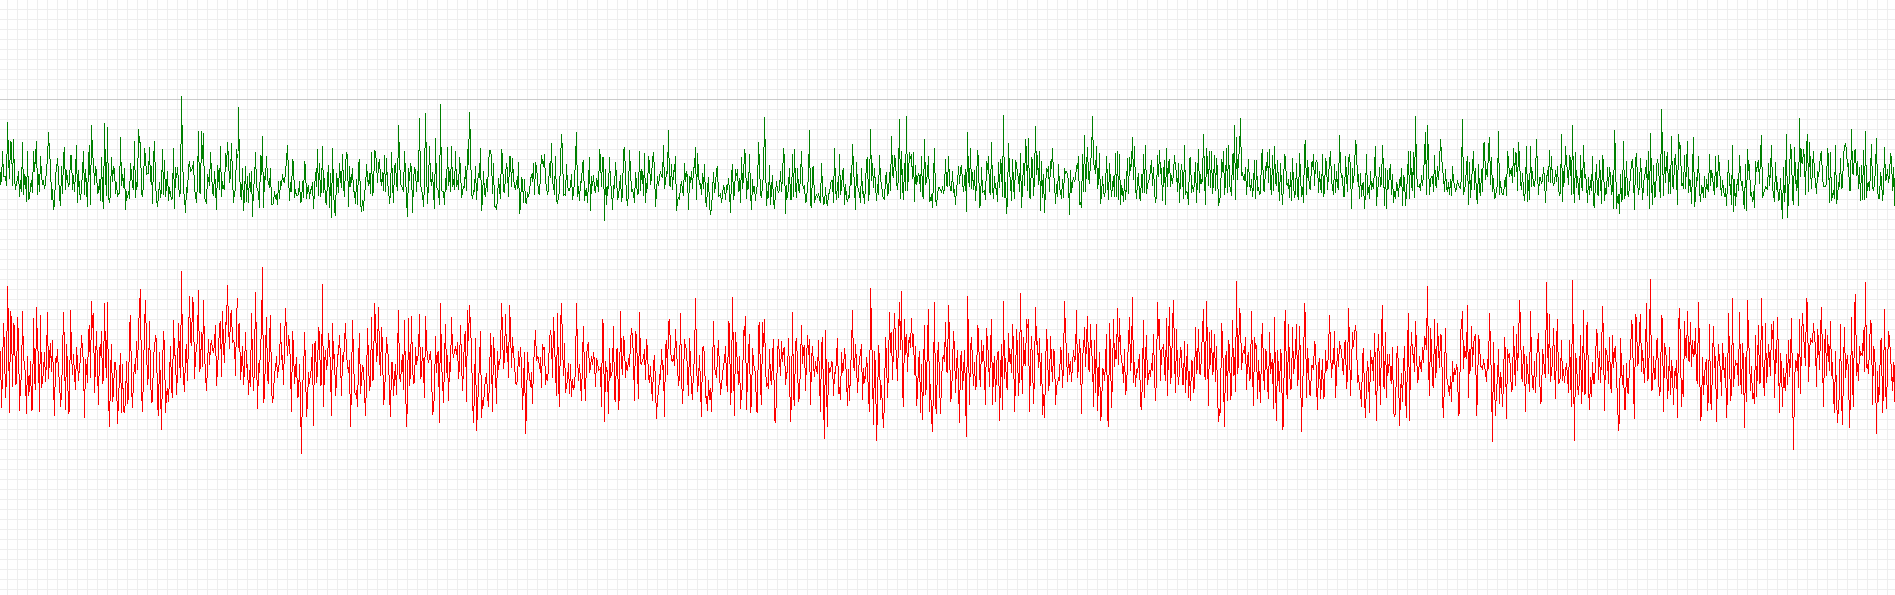
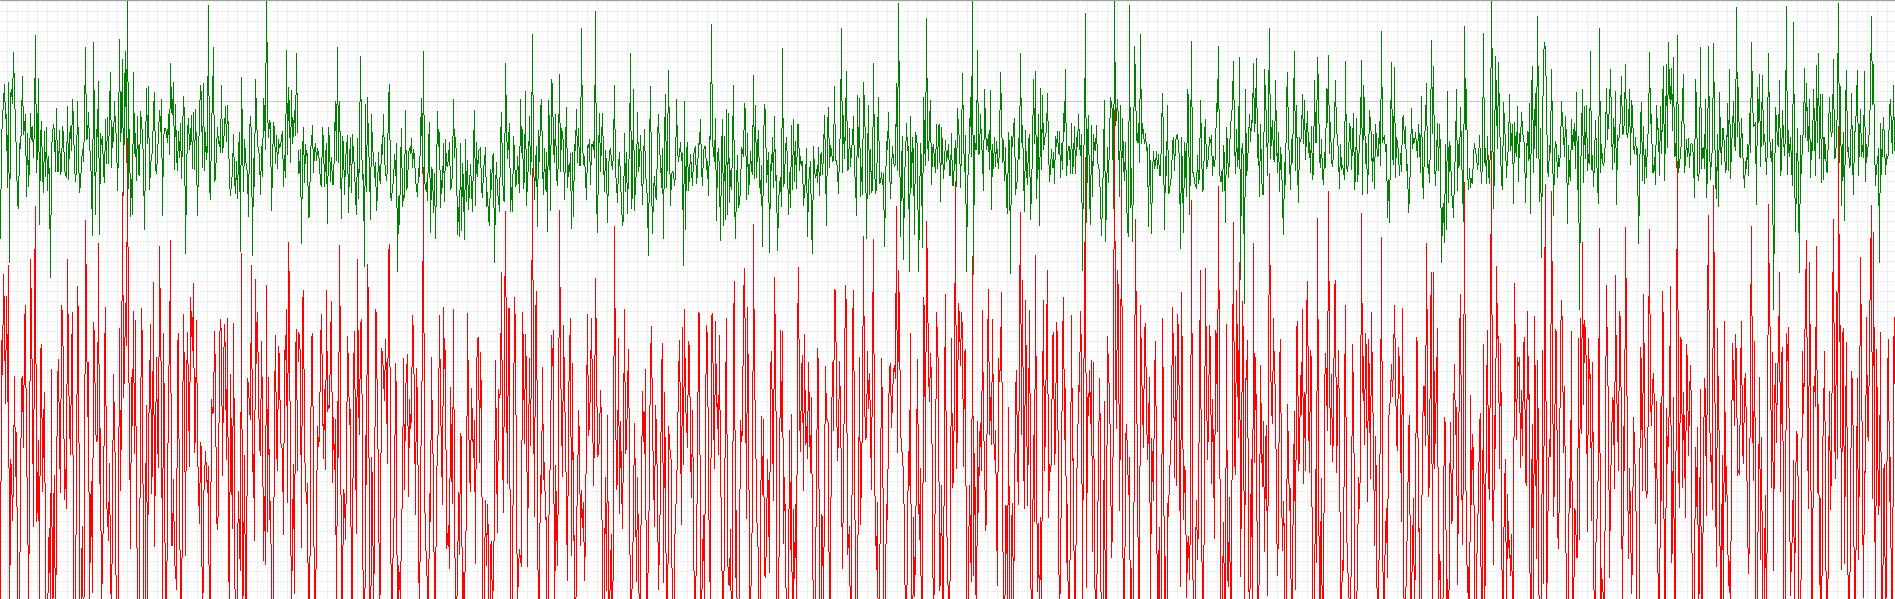
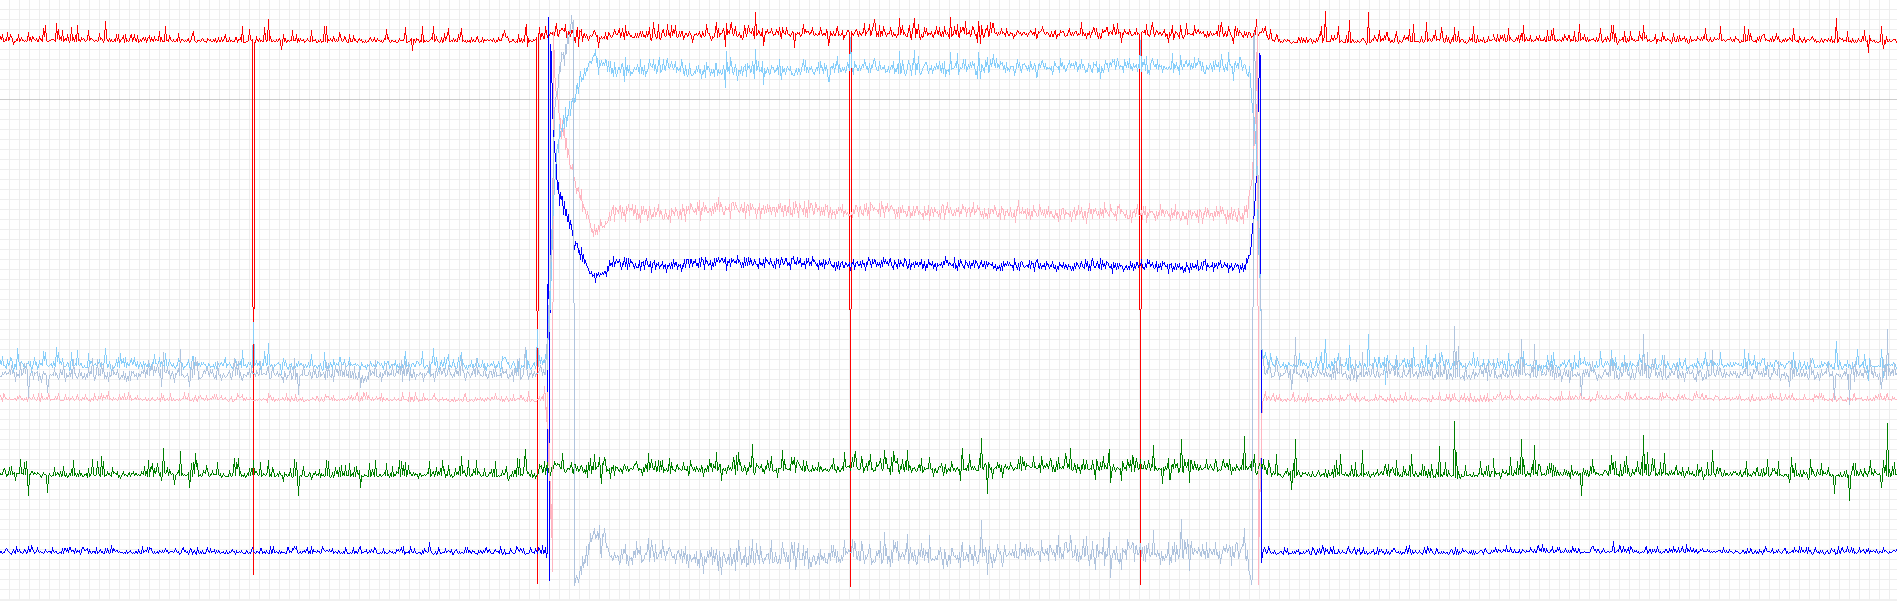
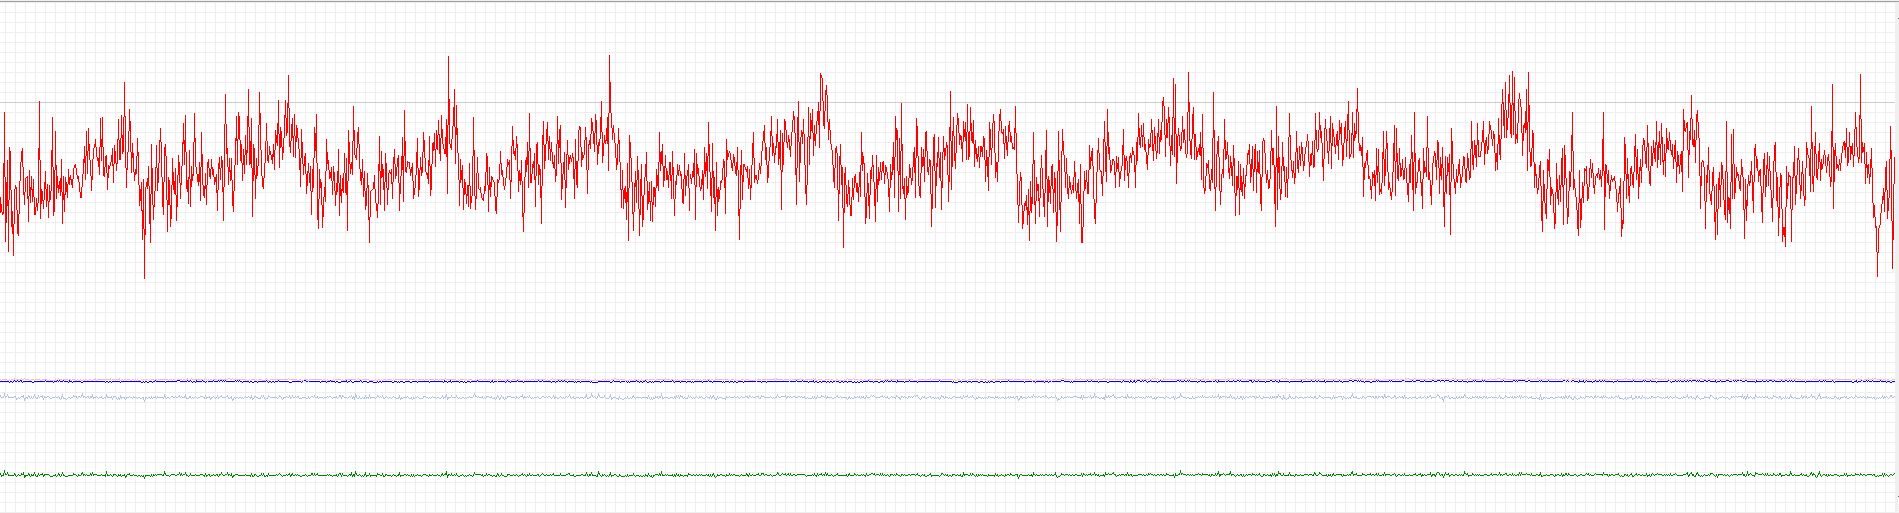
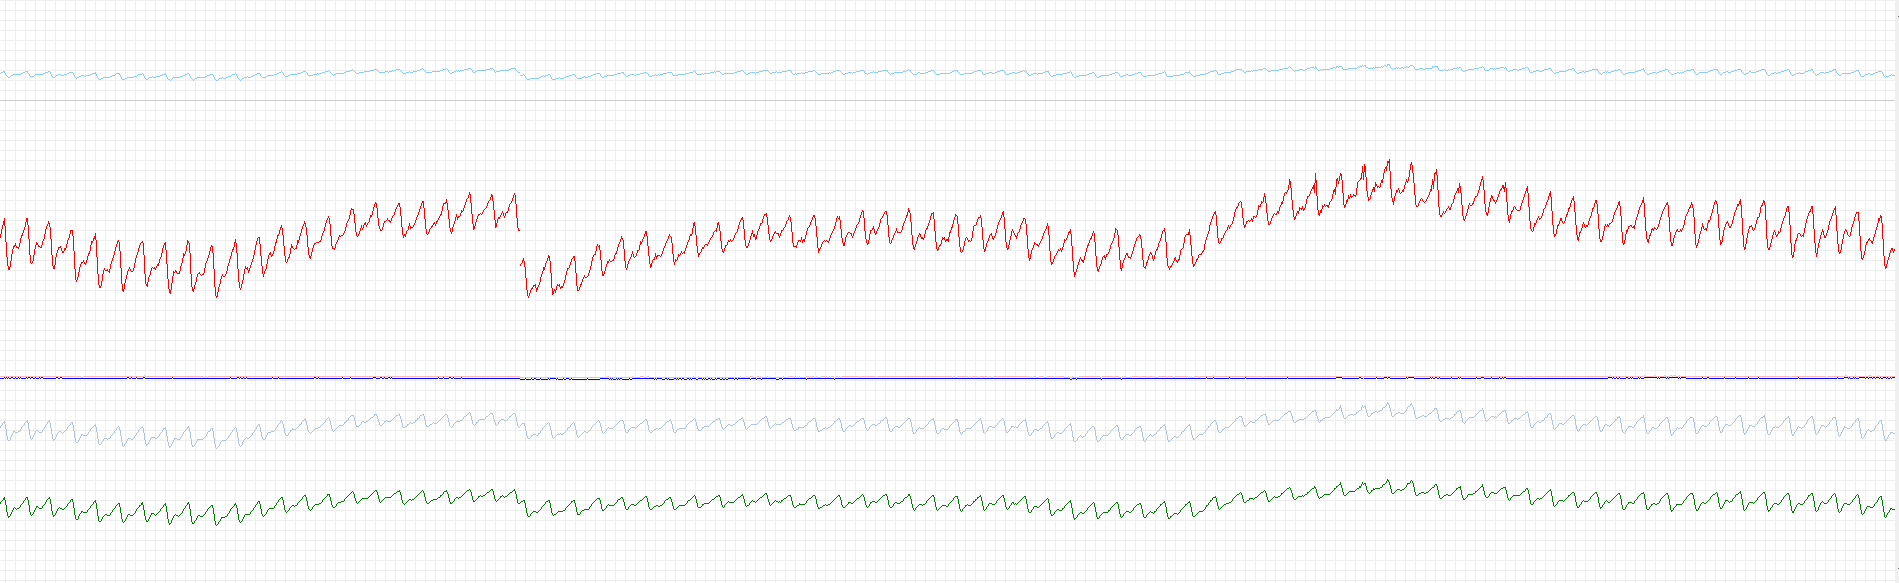
and I can get the correct reading from AFE4400 before I put my finger on, the reading does change with the distance 

but when I put my finger on the sensor, I can't see the up and down by the heartbeat.

====all register====

1==>1011101110000
2==>1111100111111
3==>1011101110000
4==>1111100111110
5==>0
6==>11111001110
7==>11111010000
8==>111110011110
9==>11111010000
A==>111110011111
B==>111110100000
C==>1011101101110
D==>10
E==>11111001111
F==>11111010010
10==>111110011111
11==>111110100010
12==>1011101101111
13==>1011101110010
14==>1111100111111
15==>0
16==>10
17==>11111010000
18==>11111010010
19==>111110100000
1A==>111110100010
1B==>1011101110000
1C==>1011101110010
1D==>1111100111111
1E==>100000000
20==>0
21==>110
22==>100101101001011
23==>0

===========

will someone please to help me?

Best regards,

Whang wen-fu


  • Hello Hwang,

    The mechanical setup, ambient light, distance between LED and PD in addition to other factors like plays a major role in getting good PPG signals from reflective sensors.

    Could you send the PPG waveform?

    Did you try the AFE TIA, 2nd stage gain settings to increase the DC and AC amplitude?

    You may also try increasing the LED current.


    Regards
    Praveen.
  • hi Praveen,

    Thanks for the reply,here is the PPG waveform

    the green one is LED1 red one is LED1 - ALED1 quite flat .... I can't see any thing from this PPG waveform ,

    also the voltage is pretty low, LED1 is only -0.009v,

    after writing  0x4406 to TIA_AMB_GAIN (which is 12db gain plus Rf = 1M)

    Regards
    Whang wen-fu.

  • I figure out where might be the problem

    After plotting six different var, in the middle of the graph ,i put my finger on the sensor 

    red //LED2

    blue //ALED2

    green //LED1

    lightpink //ALED1

    lightskyblue //LED2-ALED2

    lightsteelblue //LED1-ALED1

    It seems that LED1 and LED2 never change!!

    but because the change of ambient light, the LED1-ALED1 still change.

    What happened to LED1 and LED2 ?

  • Hi Whang,

    It looks like the LED1 and LED2 signal is saturated at the TIA output. This is because any change in the ambient light affects all the channels equally. But in your case, you do not see any change in the LED1 and LED2 channels.

    You may have to reduce the TIA gain to avoid saturating the signal.

    Could you check reducing the TIA gain?

    Also it would help to analyze better if you could provide waveforms that have the X and Y axis labels marked.

    Regards
    Praveen.
  • Hi Praveen,

    Thanks for the answer, the data seems to be good now

    after ave for 10 data point:

    and sorry that it still no labels, because the program I use doesn't have the option,

    I need to write my own plotting program to do that.

    I still have one last question, I'm using Arduino to calculate the data,

    and is this ADC DATA to voltage function is right?

     int32_t longdata = (rawspidata<<10);

    double voltage = longdata/1024/2097152*1.2;

    rawspidata is the accumulation of the 3 byte with 

    temp_byte = SPI.transfer(0x00);
    reg_value |= temp_byte << 16;

    // get second byte
    temp_byte = SPI.transfer(0x00);
    reg_value |= temp_byte << 8;

    // get last byte
    temp_byte = SPI.transfer(0x00);
    reg_value |= temp_byte;

    Thank you very much.

    Regards
    Whang.