This thread has been locked.

If you have a related question, please click the "Ask a related question" button in the top right corner. The newly created question will be automatically linked to this question.

DAC3482 CW signal harmonics and spurious output spectrum

Other Parts Discussed in Thread: DAC3482

Hi,

I am trying to understand the output spectrum of the DAC3482 EVM with TSW1400 EVM to generate the CW tone:

- For a fixed datarate and DAC setup, I observed the frequency accuracy and the close in spur is ralated to the # of samples selection in TSW1400 GUI setup. Can I get an explaination the relationships of CW tone frequency accuracy and the spur products how it is mathmatically related to the # of samples?

- Also, for a fixed # of samples in TSW1400 setup, I observed the close in spurious is also changing as the # of interpolation changes. I'd like to undersand the math relationship of what causes what I observes. Attached plots below with details of the EVM setup ( I choose CW tone to be interger division of CLK signal, because if it is not, there are a lot more mixing products. is this due to coherent setup issue? I am suprised to see datasheet spectrum does not have this issue with non-coherent setup of CW and CLK rate, would like to read paper discussion coherent setup in DAC setting if there is one)

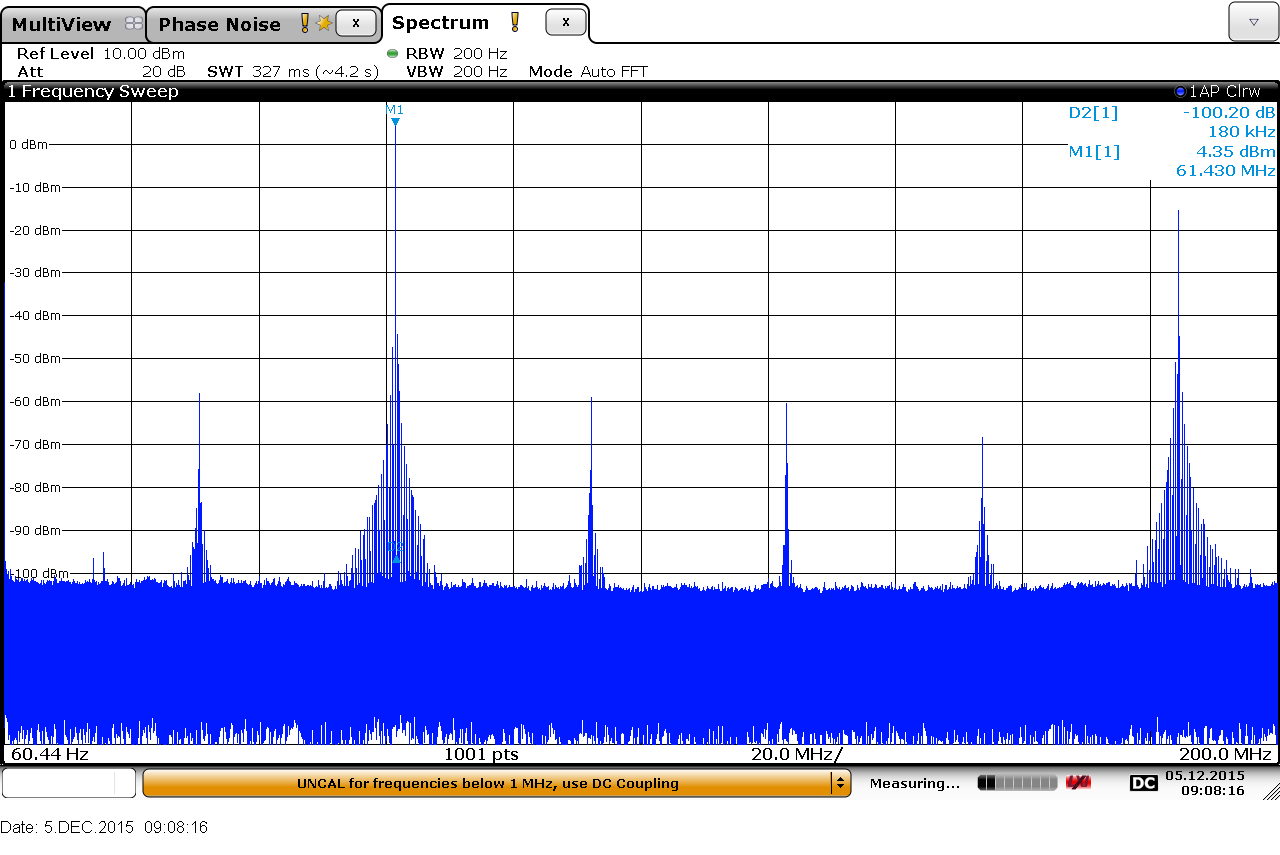
-In addition, I found all the signal I programmed has a very strong odd harmonics (3rd being -20dBc), the datasheet plots shows much lower 3rd harmonic contents of the CW output signal. What makes my EVM odd harmonics contents being so high?
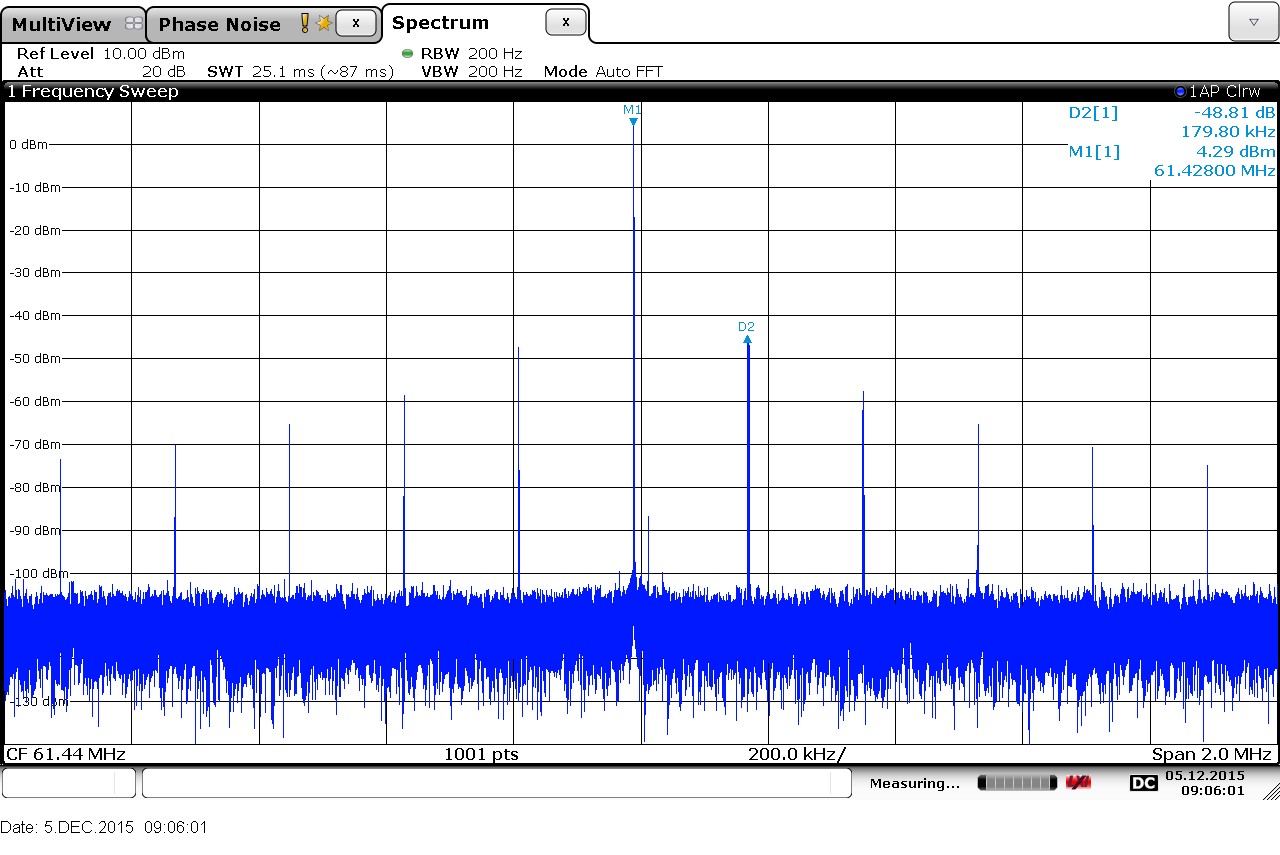
EVM Setup 1:

- DACCLK=983.04MHz

-Y1(OSTRCLK)=15.36MHz

-Y3(FPGACLK)=61.44MHz

-interpolation#=4 (NCO bypassed)

-TSW1400 datarate = 245.76MHz

-TSW1400 # of samples = 65536

-TSW1400 program CW=61.44MHz

-observed close in spur at 179.8kHz away from carrier and -48dB down, what is the source of this spur?


-EVM Setup2

- DACCLK=983.04MHz

-Y1(OSTRCLK)=122.88MHz

-Y3(FPGACLK)=245.76MHz

-interpolation#=1 (NCO bypassed)

-TSW1400 datarate = 983.04MHz

-TSW1400 # of samples = 65536

-TSW1400 program CW=61.44MHz

-observed close in spur at 364.6kHz away from carrier and -48dB down, looks like this offset frequency is doubled from previous setting?


e

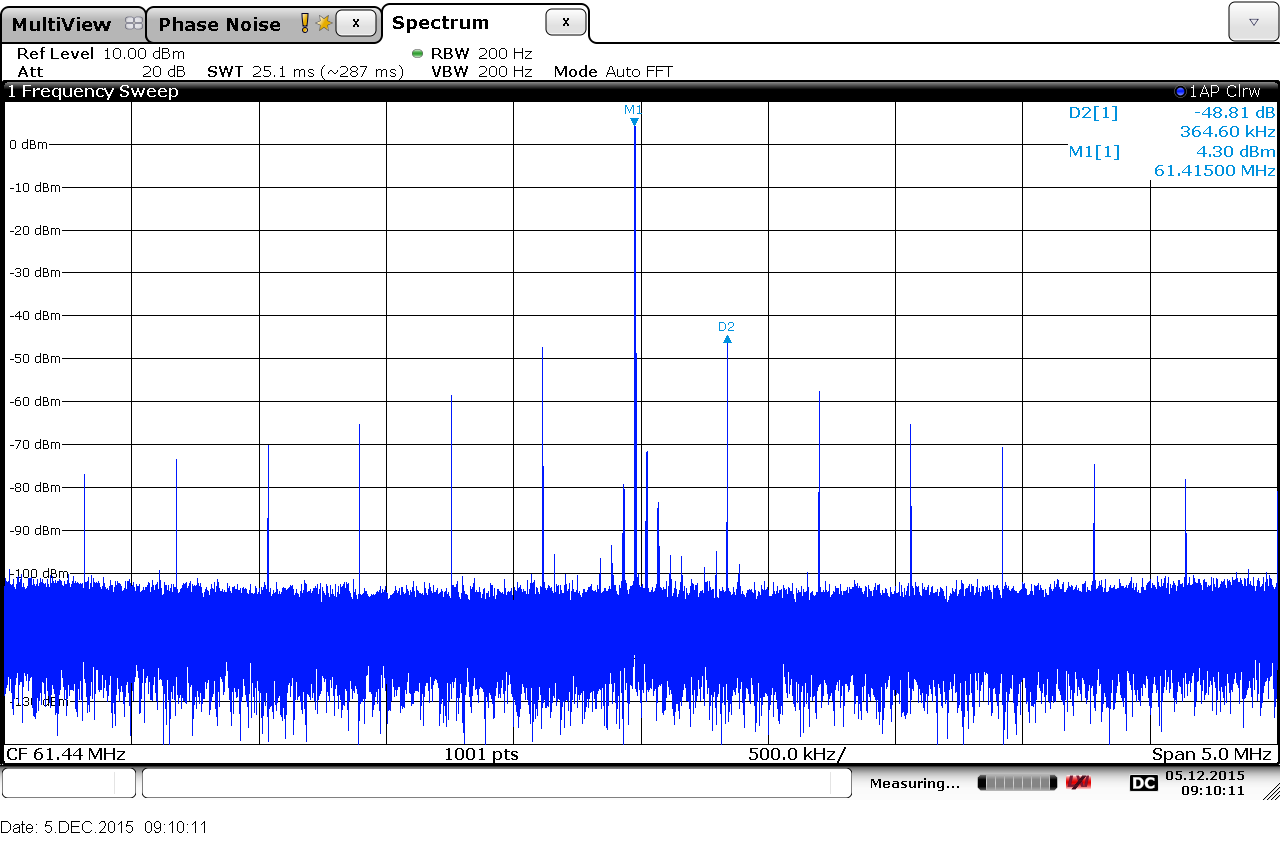
- Following is the spectrum of EVM setup 2, notice the large 3rd harmonic contents, also, there are fraction of harmonics observed in between fundemental and 2nd harmonics, 2nd harmonics and 3rd harmonics. What is the mathamtica relationships in my setup produces these fractional harmonics?

  • Florence,

    I suspect that you have the QMC gain/phase adjustment circuit enabled with the NCO/complex mixer disabled. The default EVM setup file has the QMC gain set at 1446, which is a 3dB gain to compensate for the NCO/complex mixer mixing loss.

    If you do not have the NCO/complex mixer enabled, having that 3dB gain will cause digital saturation. This may explain all the spurs that you have observed.

    Please try this and report back the spur amplitude. The spurs should disappear to more reasonable level.

    -Kang
  • Kang,

    compression is indeed the case, after disable the QMC gain, the spectrum  is much cleaner. Thanks!

    Florence

  • Kang,

    Could you comment on the relationship between frequency accuracy and the # of samples , data rate in the TSW1400 EVM setup?

    I programmed output CW signal of 10.24MHz with datarate of 983.04MHz, with Window samples of 65536 versus 32768. I got difference in output frequeny of 134kHz. Also the absolute output frequency is not on target, it is 5kHz off with #sample being 65536. I'd like to understand the frequency error relationship with the datarate and # of samples. Thanks,

  • Florence,

    Besides the standard bin size resolution (i.e. Finput data rate/# sample points), there is also a coherency calculator round up and round down difference in the HSDC PRO tone generator. The coherency calculator is used to ensure the tone generator has smooth transition of samples when looking at the end of the data stream to the next cycle of the beginning of data stream.

    I will ask our software team to try to display the actual tone generated from the coherency calculator on the next version of GUI.

    -Kang
  • Kang,

    Thanks for the input. The bin resolution size seems to be a small contributor, with datarate of 245.76MHz and # sample point being 65536 versus 32768, the bin resolution difference is 3.75kHz, but I saw 134kHz difference in output frequency... So I guess the coherence plays the bigger portion determines the absolute frequency accuracy. Any more info on coherecy calculator, and the factor goes into it, and if it can be predicted how much the output deviate from ideal frequency programed?


    Florence 

  • Hi Florence,

    The software team may extract a Labview vi code for the frequency calculator, but this is going to take some time and effort. They would really like to spend the effort on updating the output frequency display on the new HSDC PRO software instead and send that to you. 

    Would this work better? Thank you.

    -Kang

  • Hi Florence,

    here are some feedbacks regarding the algorithm:

    The algorithim really is to split the Fs/samples. This gives the Hz/bin. Then you can find which bin it falls into by dividing this into the IF frequency. Then you just put the frequency in the middle of that bin.

    For example:
    Fs=100Msps
    Nsamples=65536
    IF=9M

    Hz/bin=100M/65536=1.52587E3 Hz/bin
    9M/(Hz/bin)=5898.24 Bin
    Round to nearest Bin = 5898, mid bin = 5898.5 bin *Hz/bin
    Actual IF = 100M/65536*5898.5=9.000396..M

    I also just looked at your EVM setup #2, the DAC3482's maximum input data rate is 625MSPS. Your setup #2 has maximum input data rate of 983.04MSPS at 1x int. This setup would not work for the DAC3482. sorry I missed this before. Setup 2 is not really a valid comparison to setup 1.

    -Kang
  • Kang,

    Thank you very much for the detailed info, this is very helpful!

    You are right, I forgot the max datarate need to be half of the Fs. Thank you for pointing that out, it explains other things I was puzzling over, like the 2nd lobe of the sinc function power spectral density ratio to the DC main lobe was off from theory prediction when I had datarate of 983MHz. Thanks again and I appreciate your help on this!

    Florence

  • Kuang,

    One thing I am not clear is why the FPGACLK has to be quarter rate of the DACCLK for DAC3482. Also in TSW1400 Gui setup, the data rate has to be 4 times of the FPGACLK. Why is that? I lack the physical understand for the reason behind it and wonder if you could shed some light. Thanks,

    Florence

  • Hi Florence,

    The FPGA clock coming from the DAC EVM to the FPGA is rated at Fdata/8 due to the way the FPGA is the programmed. The data is read back on the TSW1400 memory in chunks of 8 samples, hence the clock rate has to be /8.

    This is the way the TSW1400 is structured to allow flexible design. If you are implementing FPGA on your system, the FPGA may require a different clock rate. It is design dependent.

    The DATACLK and DACCLK on the DAC EVM will not change as long as the settings of the DAC are finalized. 

    -Kang

  • Kang,

    Thank you very much for the detailed info!
    Florence