This thread has been locked.

If you have a related question, please click the "Ask a related question" button in the top right corner. The newly created question will be automatically linked to this question.

ADS1298: Cannot read the ECG signal

Part Number: ADS1298

I still have a problem to read and processing the ECG signal from ads1298.

My schematic has a bipolar power supply, where AVDD is +3.3v, DVDD +2.5v, AVSS is -2.5v and GND.

3187.ADS1298_v1.02.pdf

SPI works fine and I can read chipID and read my registers back when I set them. (Also logic analyzer confirms it)
Each my channel has a RC low-pass filter (4.7kOhms and 1000pF), then cut-off frequency is 33.8kHz.

I try to use single lead mode, so I connected the first electrode to 1P and the second to 1N, I didn't use RLD electrode. All other 7 pairs of electrodes and RLD are not connected.

write_byte(CONFIG1, 0x80 | 0x04 | 0x02); // enable 8kHz sample-rate
write_byte(CONFIG2, 0x10);
write_byte(CONFIG3, 0x08 | 0x04 | 0x80 | 0x20 | 0x40);
write_byte(CONFIG4, 0x02);

write_byte(RLD_SENSP, 0x00);
write_byte(RLD_SENSN, 0x00);
write_byte(LOFF_SENSP, 0xFF);
write_byte(LOFF_SENSN, 0x02);
write_byte(LOFF_FLIP, 0x00);
write_byte(LOFF_STATP, 0x00);
write_byte(LOFF_STATN, 0x03);
write_byte(GPIO, 0x00);
write_byte(PACE, 0x00);
write_byte(WCT1, 0x08);
write_byte(WCT2, 0x00);

And read data when my DRDY is toggled

int ch = 1;
for (int i=3*ch; i<3*ch+3; i++) // miss the first 3 bytes of header
{
NRF_LOG_INTERNAL_RAW_INFO("%d\r\n", out[i]); // out is my data
}

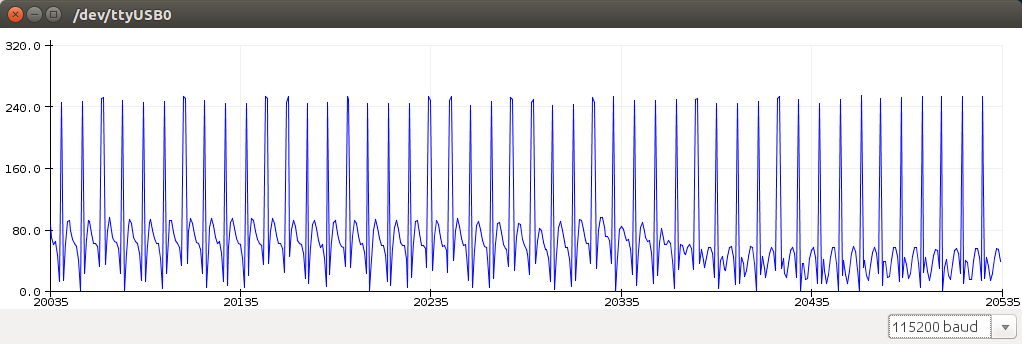
I wrote a simple code in Processing which gets the serial data and draws the chart

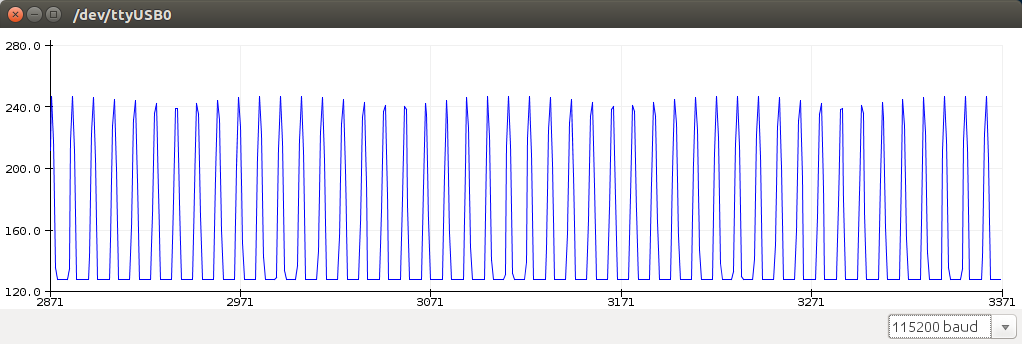
When I put my 2 electrodes on my right and left wrists I get this image

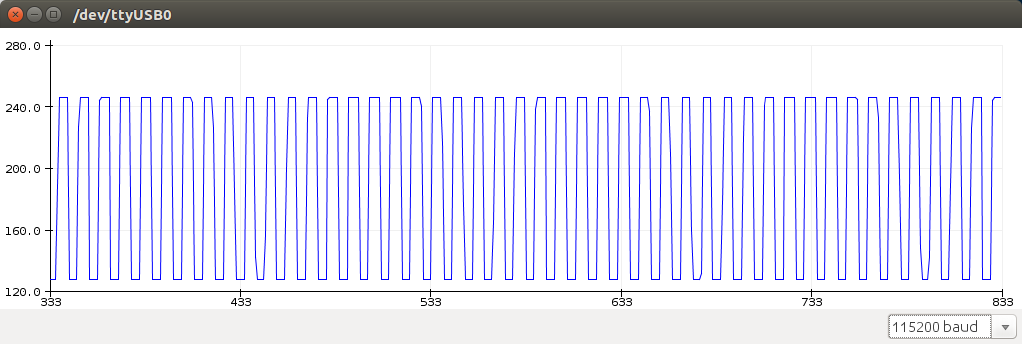
When I put off these 2 electrodes I can see this one

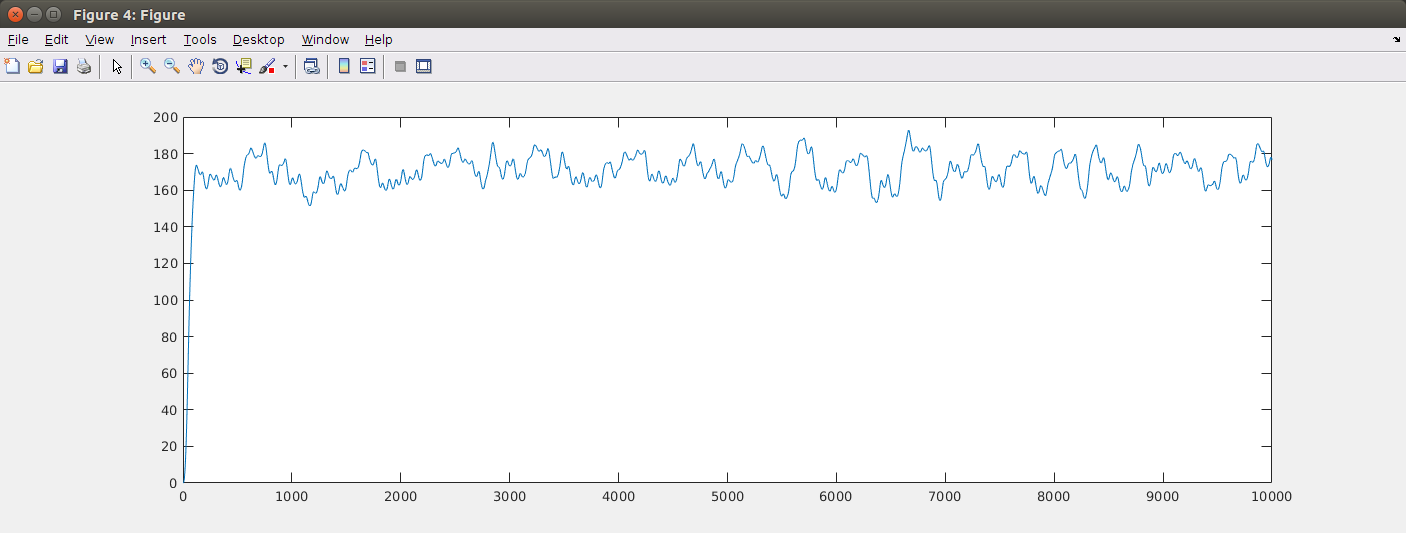
My sample rate is 250 SPS, also I saved my output data to file for processing it in MATLAB using Butterworth low-pass filter of 3rd order.

sig = load('ecg.txt');
Fs = 250; % the sample rate frequency of my ads1298
Fc = 50; % cut-off frequency of 50Hz
[b,a] = butter(3,Fc/(Fs/2), 'low'); % the 3rd order of filter
freqz(b,a);

LPF = filter(b,a, sig);
plot(LPF);

But I see not I expected, there is no clear peaks and PQ segments

  • Hello Ivan,

    If the inputs are DC coupled and there is no RL electrode, then the signals do not have a valid common-mode voltage and therefore the ADC will not be able to measure them. Do the results improve if you use a RL electrode connected to the RLD amplifier?

    Brian
  • Hi Brian, thanks for your reply. I tried to connect RLD electrode and got this chart

    Seems it doesn't look like ECG

  • Hello Ivan,

    Have you tried to input a simple sine wave using a signal generator to validate that the signal chain is working properly? This would be good to determine if the issue is related to the design/software or if it related to the ECG connections.

    Brian
  • Hello Brian!
    I haven't tried, but I found that my chart is changing when I put on or off the electrodes. It looks better then on my screenshots above. Using RLD my signal is almost has a line picture. Also after filtering it by Butterworth filter I have a stable straight signal.

    Just wanna know, are my configs correct?
    Maybe there is a problem? Should I reconfigure something else besides CONFIG1-3, channels and RLD?

    And one more question, I set for ch1 the value of NORMAL | SHORTENED, cause I use only them and I set 0x00 for other unused electrodes, but I didn't tie them to avdd and they are floating in the air. Should I tie them?

    Am I right that I expect to get the same sine-wave which I generate on input using your suggestion?
  • Ivan,

    The configuration is correct. You should at lead be able to see an ECG signal. What is the input during these tests? Are the inputs all floating or connected to the patient.

    Unused channels should be disabled by setting bit 7 of the CHnSET register corresponding to the unused channels. Tie the inputs to those channels to AVDD if they will never be used.

    If you apply a sine wave to the inputs, you should measure a sine wave at the output. Just make sure the sine wave is within the common-mode range of the device and the frequency is within the bandwidth of the device for the data rate you are using.

    Regards,
    Brian Pisani
  • Brian,

    thanks for your suggestion, but I just can't understand one thing. ads1298 is a kind of differential amp, if I plug sine wave generator output to 1P pin of ads1298, so what I have to do with 1N pin. Do I need to plug it to GND? or what?

    In the future I'm going to use other inputs.

    I don't have at my hand a sine waveform generator, but I'm going to use Arduino to generate it and pass to analog pin. Is it ok?

    I generate this sine something like that

    int b = 180;
    for (int j = 0; j < 360; j++)
    {
         float a = sin(j * (PI / b));
         analogWrite(PIN, a);
    }

    b variable is helping to change the frequency

    and should I use 1k resistor to tie unused channel to AVDD?

  • Ivan,

    Yes you need to connect the negative input to something when you feed a signal to the positive input. The best voltage to provide to the negative input is (AVDD + AVSS)/2.

    In theory your method for generating a signal is good, but you will need to make sure the frequency is within the bandwidth of the ADS1298. Do you know how long it takes the MCU to run through the for loop once?

    If you plan on using the other channels eventually, then don't worry about tying the inputs high. When you are past the prototype stage, or are trying to optimize power consumption, then you can be more careful about the unused inputs.

    Brian
  • Hi Brian,

    Ok, so according to the formula you mentioned my negative pin should have (3.3-2.5)/2=0.4v, so then GND (0v) is ok.

    If I generate the sine signal with help code, in theory I can put the delay in main loop. I'm going to use arduino mega for this purpose, unfortunately I haven't found a correct info about the frequency of main loop. Hope I'll be able to adjust the values of delays empirically.

    I'm a little bit confused with my input frequency. I put a RC filter with about 33.8 kHz for each electrode, I found that ECG bandwidth should be 0.05Hz to 100-150Hz and could it make some noises for my signal of interests?
  • Hello Ivan,

    Sorry about the late response. Is your AVDD 3.3V and your AVSS -2.5V? If this is the case then your analog power supplies are outside of the recommended operating conditions shown on page 12 of the datasheet.

    Regarding the bandwidth, the ADS1298 has an internal digital filter (refer to section 9.3.2.4 of the datasheet) that will limit the bandwidth much lower than the RC filter. The noise shown in tables 1-4 in the datasheet takes this digital filter into account.

    Regards,
    Brian
  • Hello Brian,

    I was wrong, my AVDD is 2.5V.

    So, I generated sine and square signals

    This is original sine signal's plot - 10Hz

    and what I got from ads1298

    And my square signal - the same 10Hz

    original

    and from ads1298

    as we can see, signals almost are the same, but it's strange for me, because the pictures above were made when I read 1 byte from ads1298 (I missed first 3 bytes of header, the next 3 bytes are for channel 1) if I read all three bytes of channel one I have a noise.

    but when put 1P and 1N electrodes on my chest or wrists and scan the signal

  • Hey Ivan,

    It looks as if the plots you are generating before you measure with the ADS1298 are at a much higher sample rate than the ADS1298 and thus appear to be "stretched out". Also, when you input a sine wave to the ADS1298, what is the common mode of the inputs? It looks like the signal is going out of range.

    The ECG signal actually looks good though!

    Brian