This thread has been locked.

If you have a related question, please click the "Ask a related question" button in the top right corner. The newly created question will be automatically linked to this question.

ADS1298R: Sharp peaks in Impedance pneumography (respiration)

Expert 1110 points
Part Number: ADS1298R
Other Parts Discussed in Thread: ADS1296R,

Hi,

In my system I use an ADS1296R to measure three channels of ECG and one channel for respiration. Everything looks promising. But sometimes I see sharp peaks in the impedance measurement (for respiration) that I believe are related to heart activity. I'd like hear your ideas.

1- Is it normal?

2- What can be done to suppress it? I know that filtering the signals with a 1Hz low-pass filter will remove those sharp peaks completely. But is there any way to skip this filter, at least for monitoring purposes? 

3- What is the theoretical reason behind it?

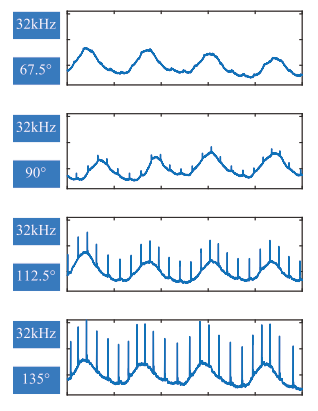
I ran a test with all the different modulation phase delays, and the result showed that with  modulation frequency of 32 kHz and phase of 62.5 degrees, the peaks disappear. This is while the datasheet claims that a phase of 112.5 results in the best performance, at least from the noise point of view. However, I know that the results would differ with different subjects and electrode locations. Please comment on this too.

Update:

Here are some examples about those peaks:

  • Hello Vala,

    Thanks for your interest in our ADS1298R!

    It's difficult to know for sure what is going on. To start, could you please share:

    1. The complete register settings for the ADC
    2. A plot showing the output waveform with the spikes you observed

    Electrode placement is really up to you - TI tries to learn as much as possible about our customers' applications, but in the end we are not the experts. For respiration, I know that the measurement electrodes must span the thoracic cavity, but I've seen them placed as close as a few inches apart or as far apart as the wrists, all with varying results, I'm sure. Have you tried evaluating your system first with a known good signal source, such as a patient simulator?

    Best Regards,

  • Hi Ryan,

    Thanks for your answer. I have updated my post with some examples. And the numbers next to the plots show different settings for the registers. About the electrode locations, yes you are right. I have also experienced that the different electrode locations have different results. Even between different subjects the same electrode location may result in different outputs. The figure above shows the signals when the electrodes are put on the right and left flanks. This study shows that this is the best electrode location, which makes sense since it includes a large area of thorax and also it includes both of the lungs.
    link.springer.com/.../978-3-540-89208-3_417

    In my study, I noticed that with different register settings, those sharp peaks are suppressed (I can share my thesis work when published). However, I wanted to know if there is anything that I am not aware of and can diminish this effect. True, these peaks can be removed by a low-pass filter, but as you know I'd prefer to do the rate estimation as simply as possible for the sake of computational complexity.
  • Hi Vala,

    Could you please share the register settings for the device? I'd like to check how everything else is configured besides the respiration modulation frequency and the blocking phase setting.

    Have you checked the period of the spikes? Does it seem to correlate to the output data rate or some other switching component in your system?

    Best Regards,

  • Hi Ryan,

    I will retrieve the register values and get back to you. I believe the peaks are correlated with the R-peaks in the ECG signal. I will try to find some signals from my recordings which illustrate this fact.

    BR, Vala
  • Thanks for the update, Vala. Could you also share a complete schematic of the design? The ECG should not be coupling through on the respiration channel.

    Best Regards,