This thread has been locked.

If you have a related question, please click the "Ask a related question" button in the top right corner. The newly created question will be automatically linked to this question.

AFE4300: Inconsistent values from ADC CONTROL REG 2 (ADDR 0x10)

Part Number: AFE4300

Hi,

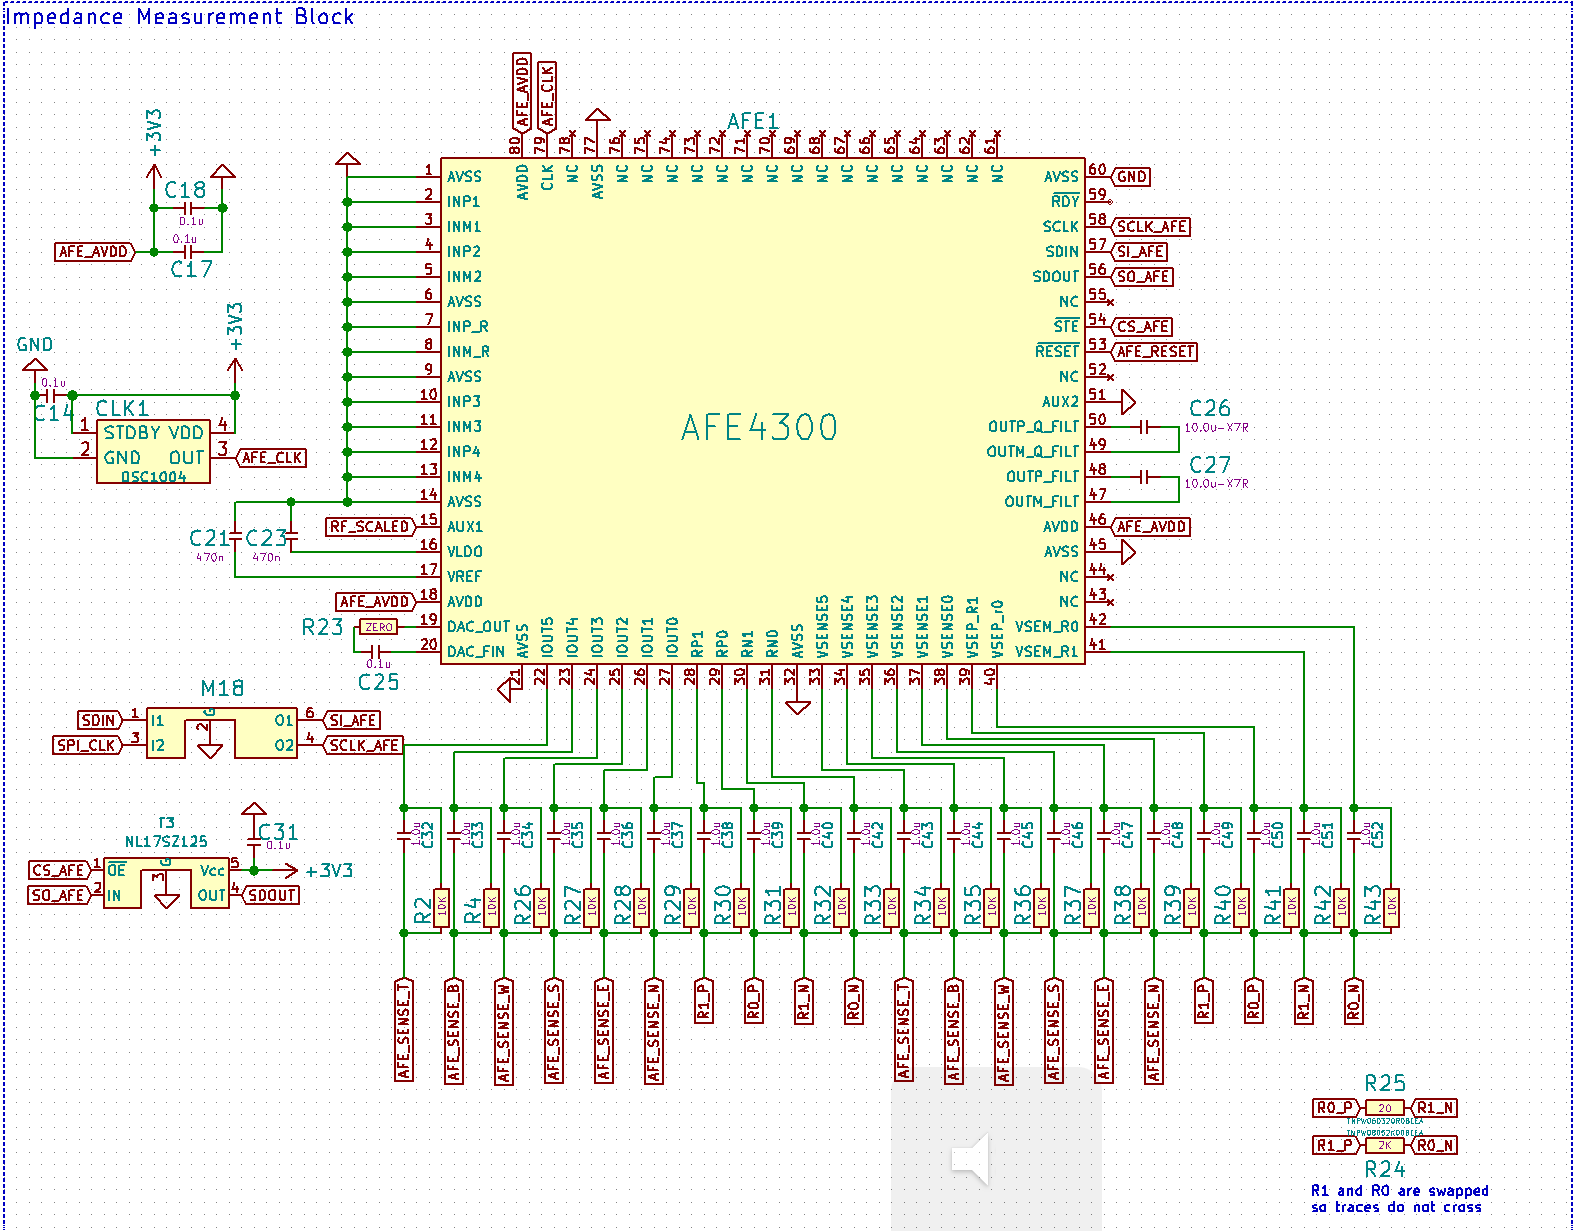
I'm having trouble reading consistent values from the BCM output (ADC_CONTROL_REGISTER2 Addr 0x10).

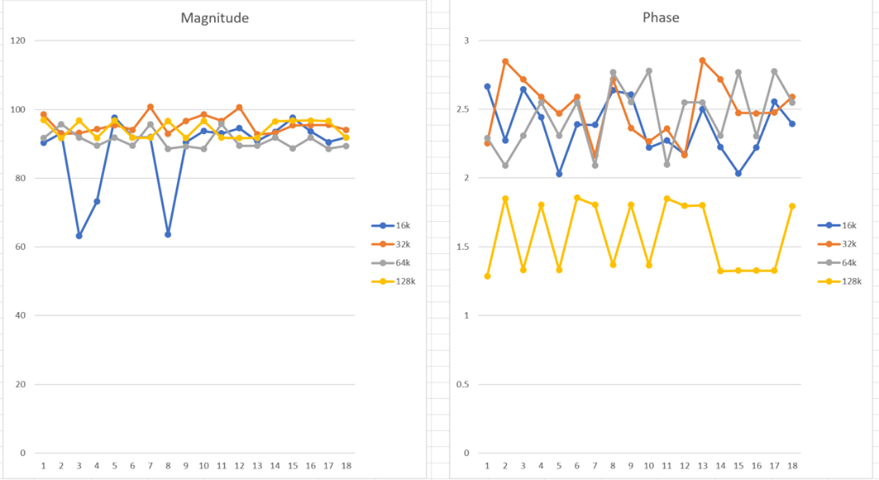
Setting this register to 0x65 -- output for (OUTP_Q_FILT/OUTM_Q_FILT) -- returns consistent values on multiple measurements at the same frequency (i.e. 0xff13, 0xff19, etc.), but when setting the register to 0x63, the measurements return very different (i.e. 0xe9e, 0x2bac, etc.). However, the circuit for each is consistent/same. 

Any ideas on what might cause this to occur? Appreciate any help and direction.

Thanks!

  • Side question, anyone have the timing spec for the MUX for switching the outputs?
  • Hi Terence,

    Can you measure the voltage across OUTP_Q_FILT and OUTM_Q_FILT ( also OUTP_I_FILT and OUTM_I_FILT)?
    Switching of the MUX should be fast enough.

    Regards,
    Prabin
  • We measured about 0.9V after switching the muxes. There's some instability for roughly ~200 ms before the muxes and the stable voltage at 0.9V.
  • Hi Terence,

    Is 0.9V expected for the given impedance?
    Also if you insert the wait time of 200mS in your code , does the measurement becomes stable?

    Regards,
    Prabin
  • Hi Prabin,

    Thanks for the reply. 

    1. How would I calculate the expected voltage given the impedance? I might have missed this in the datasheet. 

    2. Yes, the wait time (>200ms) did help make the measurement stable. Our data collection process is - 1) performing multiple impedance measurements (we've been testing around 7-11 measurements, 860SPS each) and getting the average 2) Performing separate/independent task for ~40-60 seconds 3) repeat 1&2. What we're finding is that while within each measurement cycle, the values are fairly consistent or within tolerance. However, the cycles relative to each other are not consistent, as you can see in the screenshot below. The wait time does help minimize the deviations but only to a certain extent. Any ideas? 


    Cheers,

    Terence

  • Hi Terence,

    In FWR mode the expected voltage will be ~ (0.5 *1.05Vpp* Impedance / 1.5KOhm ).
    Form your plot I have few questions:
    1) Each plot is for different excitation frequency , isn't it?
    2) during delay of 40-60 sec , do you switch off signal chain or change any parameter ( excitation frequency).
    3) Can you please measure the calibration resistors before you take any measurement after the delay of 40-60 sec delay? If calibration resistors has a same trend, you can use this information to correct the measurement for other impedance. In fact we call this as calibration routine as discussed in section 8.2.2.

    Regards,
    Prabin
  •  Hi Prabin,

    Could you please take a look at our schematic? Perhaps we're not implementing it correctly... we do not switch off the signal chain during the delay, and we did follow the calibration routine (after each frequency switch) after  each 40-60 sec delay, but still no luck in getting good measurements.