This thread has been locked.

If you have a related question, please click the "Ask a related question" button in the top right corner. The newly created question will be automatically linked to this question.

ADC12D1620QML-SP: Measured ENOB Much Lower Than Data Sheet at Higher Frequencies

Part Number: ADC12D1620QML-SP

I'm testing the ADC12D1620QML-SP in DESIQ mode with a sample clock of 1.28 GHz, which provides a sample rate of 2.56 Gsps real.  The sample clock is generated by an Agilent signal generator.  The 1.28 GHz tone passes through an analog bandpass filter to remove harmonics produced by the signal generator.  A second signal generator is used to generate 90, 1000, and 2400 MHz tones to be digitized by the ADC.  Each of these tones is also passed through an analog bandpass filter to remove harmonics produced by the signal generator.  The two signal generators are phase locked so the frequency of the digitized time series exactly matches the frequency on the signal generator front panel.

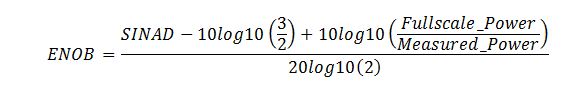
I measured ENOB at the three frequencies.  The measured ENOB is fairly close to the ENOB specified in the data sheet at 90 and 1000 MHz, but is significantly lower than the data sheet at 2400 MHz.  The 2400 MHz tone falls in the second Nyquist region.  So, this tone shows up at 2.56e9 - 2.4e9 = 160 MHz in the digitized time series.  

I waited until the ADC reached a steady state temperature before performing my measurements.  I used the ADC Calibration feature before every data collection.  I adjusted the "Q Channel Offset Adjust" register to minimize the spur at fs/2.  I adjusted the "DES Timing Adjust" register to minimize the spur at fs/2 - fin.

Do you have any ideas why the measured ENOB at 2.4 GHz is much lower than the ENOB specified in the data sheet?  Can you provide me with recommendations to increase the measured ENOB at 2.4 GHz?

Continuous Tone Freq (MHz)

Data Sheet ENOB

Measured ENOB

Siggen Sample Clock

90

9.3

8.8

1000

8.5

8.4

2400

6.7

4.9

Regards,

Scott

  • Hi Scott

    Can you share FFTs for the 3 cases?

    What is the converted signal level at each frequency? Is it -0.5dBFS as used for the datasheet parameters?

    What amplifier or balun are you using to convert the single ended signal from the generator and bandpass filter to differential for the ADC inputs?

    Can you confirm the ADC inputs are AC-coupled, and the Vcmo pin (column C2) is connected to GND?

    If we can understand what is limiting the ENOB performance at 2400 MHz input frequency we can work to improve things.

    Best regards,

    Jim B

  • The converted signal is 1 to 1.5 dB below full scale.  I'm using the ENOB formula below.  The term 10log10(Fullscale_Power/Measured_Power) extrapolates the ENOB measurement to full scale.  If the signal is 1.5 dB below full scale, this term equals 1.5 dB.  Increasing the converted signal power to 0.5 dB below full scale won't improve the ENOB.  In fact, it might degrade slightly.  If I test with a signal that is 20 dB below full scale, the input signal dependent spurs drop, the formula extrapolates the measurement up to full scale, and I get unrealistically high ENOB measurements that can exceed the ENOB listed in your data sheet.

    Here are the FFT's.

    Here are the answers to your hardware related questions.

    What amplifier or balun are you using to convert the single ended signal from the generator and bandpass filter to differential for the ADC inputs?

    JR: There is no amplifier. Input balun for RF analog input is Mini Circuits PN: TCM1-1-13M-4+

    https://www.minicircuits.com/pdfs/TC1-1-13M+.pdf

    Can you confirm the ADC inputs are AC-coupled, and the Vcmo pin (column C2) is connected to GND?

    JR: ADC inputs are AC coupled with 0.22uF capacitors, respectively. VCMO pin is pulled down to ground with 100Ω resistor. 

  • Hi Scott
    I'll try to gather some comparative data tomorrow to see how 2400 MHz input looks in my setup.
    Stay tuned.
    Best regards,
    Jim B
  • Hi Scott

    Based on your FFT results and my testing it looks like your performance is being limited by HD2 (folds to 320 MHz) and the Fs/2-HD2 (1280 - 320=960 MHz).

    In my testing I am not able to get the standard interleaving spurs (Fs/2-Fin, Fs/4+Fin and Fs/4-Fin) quite as low as you have, but my HD2 and Fs/2-HD2 results are better, at around -53 and -47 dBFS respectively with a -1.2 dBFS input. The interleaving spurs are below the level of these HD2 related spurs and the overall performance if I disregard the fixed frequency Fs/2 spur is ENOB = 7.125 Bits FS.

    Please verify that your bandpass filter at 2400 MHz is maintaining low HD2 at the input to the balun. The next area to check would be the balun itself or the board routing from balun to ADC inputs. Phase or amplitude imbalance in the signal path can degrade HD2 performance significantly. I know the balance of the TC1-1-13M+ balun starts to degrade somewhat at higher frequencies, but the TC1-DESIQ-BB (http://www.ti.com/tool/TC1-DESIQ-SBB) I am using to drive the ADC in DESIQ mode is based on the same balun, so that in itself shouldn't be causing the higher HD2 levels in your system.

    Best regards,

    Jim B

  • Hi Jim,

    I verified that the bandpass filter at 2400 MHz is maintaining low HD2 at the input to the balun.  Our RF engineer sees the HD2 spur at the balun output.  I assume this is due to a phase or amplitude imbalance as you mentioned above.  The RF engineer is working on a solution.

    Regards,

    Scott